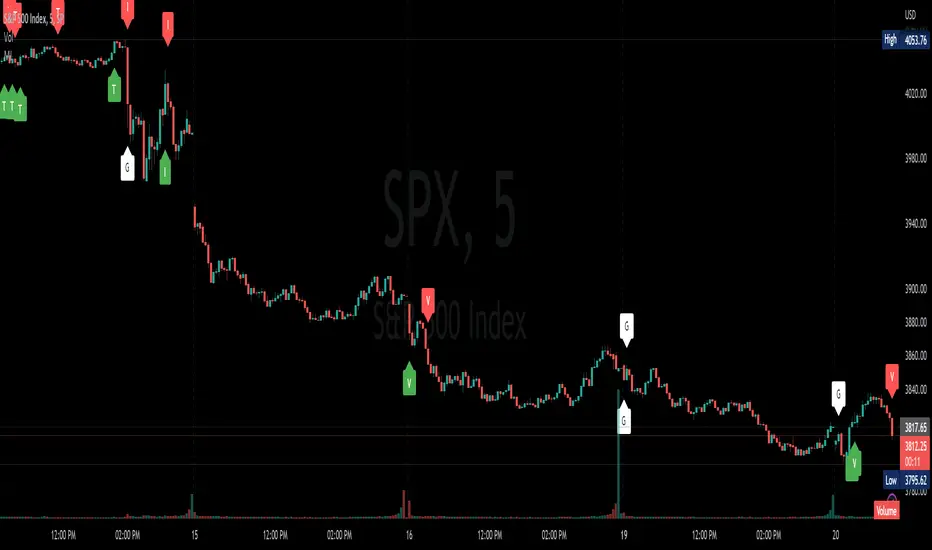
Market InternalsMarket internals can be a powerful tool for determining future moves, overall trend health and provide a means of directional confidence.
This indicator watches a handful of SPX and US stocks based internals to determine key areas of sentiment changes, the internals monitored are:
US Stocks Ticks
Call and Put SPX Volume
SPX Gamma Dispersion
US Stocks Ask and Big Volume
US Stocks Advancing and Declining Issues
Each time there's a bullish or bearish sentiment change it will be market with green/red flag and a single letter that identifies what market internal has changed.
SPX gamma dispersion events aren't to be considered directional from historical observations made but can be a sign of liquidity adjustments and when paired with any of the other aforementioned internals sentiment changes can be used as a powerful signal.
If it's observed that market internals are changing erratically then it's a clear indication of market chop and best to wait for cleaner trends.
Future updates may include non-SPX based internals analysis, change in display, alerts/alertconditions and more. Feel free to comment with any desired changes and we can discuss!
Поиск скриптов по запросу "market internals"
Market Internals [Makit0] MARKET INTERNALS INDICATOR v0.5beta
Market Internals are suitable for day trade equity indices, named SPY or /ES, please do your own research about what they are and how to use them
This scripts plots the NYSE market internals charts as an indicator for an easy and full visualization of market internal structure all in one chart, useful for SPY and /ES trading
Description of the Market Internals
- TICK: NYSE stocks ticking up vs stocks ticking down, extreme values may point to trend continuation on trending days or reversal in non trending days, example of extreme values can be 800 and 1000
- ADD: NYSE stocks going up vs stocks going down, if price auctions around the zero line may be a non trend day, otherwise may be a trend day
- VOLD: NYSE volume of stocks up vs volume of stocks going down, identify clearly where the volume is going, as example if volume is flowing down may be a good idea no to place longs
- TRIN: NYSE up stocks vs down stocks ratio divided by up volume vs down volume ratio. A value of 1 indicates parity, below that the strength is on the long side, above the strength is in the short side.
A basic use of market internals may be looking for divergences, for example:
- /ES is trading in a range but ADD and VOLD are trending up nonstop, may /ES will break the range to the upside
- /ES is trading in a range and ADD and VOLD are trading around the zero line but got an extreme reading on TICK, may be a non trending day and the TICK extreme reading is at one of the extremes of the /ES range, may be a good probability trade to fade that move
- /ES is trading in a trend to the downside, ADD and VOLD too, you catch a good portion of the move but are fearful to flat and miss more gains, you see in the TICK a lot of extreme values below -800 so your're confident in the continuation of the downtrend, until the TICK goes beyond -1000 and you use that signal to go flat
Market internals give you context and confirmation, price in /ES may be trending but if market internals do not confirm the move may a reversal is on its way
Price is an advertise, you can see the real move in the structure below, in the behavior of the individual components of the market, those are the real questions:
- How many stocks are going up/down (ADD)
- How many volume is flowing up/down (VOLD)
- How many stocks are ticking up/down (TICK)
- What is the overall volume breath of the market (TRIN)
FEATURES:
- Plot one of the four basic market internal indices: TICK, ADD, VOLD and TRIN
- Show labels with values beyond an user defined threshold
- Show ZERO line
- Show user defined Dotted and Dashed lines
- Show user defined moving average
SETTINGS:
- Market internal: ticker to plot in the indicator, four options to choose from (TICK, ADD, VOLD and TRIN)
- Labels threshold: all values beyond this will be ploted as labels
- Dot lines at: two dotted lines will be plotted at this value above and below the zero line
- Dash lines at: two dashed lines will be plotted at this value above and below the zero line
- MA type: two options avaiable SMA (Simple Moving Average) or EMA (Exponential Moving Average)
- MA length: number of bars to calculate the moving average
- Show zero line: show or hide zero line
- Show dot line: show or hide dotted lines
- Show dash line: show or hide dashed lines
- Show labels: show or hide labels
GOOD LUCK AND HAPPY TRADING

Market Internals (TICK, ADD, VOLD, TRIN, VIX)OVERVIEW
This script allows you to perform data transformations on Market Internals, across exchanges, and specify signal parameters, to more easily identify sentiment extremes.
Notable transformations include:
1. Cumulative session values
2. Directional bull-bear Ratios and Percent Differences
3. Data Normalization
4. Noise Reduction
This kind of data interaction is very useful for understanding the relationship between two mutually exclusive metrics, which is the essence of Market Internals: Up vs. Down. Even so, they are not possible with symbol expressions alone. And the kind of symbol expression needed to produce baseline data that can be reliably transformed is opaque to most traders, made worse by the fact that prerequisite symbol expressions themselves are not uniform across symbols. It's very nuanced, and if this last bit was confusing … exactly.
All this to say, rather than forcing that burden onto you, I've baked the baseline symbol expressions into the indicator so: 1) the transform functions consistently ingest the baseline data in the correct format and 2) you don't have to spend time trying to figure it all out. Trading is hard. There's no need to make it harder.
INPUTS
Indicator
Allows you to specify the base Market Internal and Exchange data to use. The list of Market Internals is simplified to their fundamental representation (TICK, ADD, VOLD, TRIN, VIX, ABVD, TKCD), and the list of Exchange data is limited to the most common (NYSE, NASDAQ, All US Stocks). There are also options for basic exchange combinations (Sum or Average of NYSE & NASDAQ).
Mode
Short for "Plot Mode", this is where you specify the bars style (Candles, Bars, Line, Circles, Columns) and the source value (used for single value plots and plot color changes).
Scale
This is the first and second data transformation grouped together. The default is to show the origin data as it might appear on a chart. You can then specify if each bar should retain it's unique value (Bar Value) or be added to a running total (Cumulative). You can also specify if you would like the data to remain unaltered (Raw) or converted to a directional ratio (Ratio) or a percentage (Percent Diff). These options determine the scale of the plot.
Both Ratio and Percent Diff. convert a given symbol into a positive or negative number, where positive numbers are bullish and negative numbers are bearish.
Ratio will divide Bull values by Bear values, then further divide -1 by the quotient if it is less than 1. For example, if "0.5" was the quotient, the Ratio would be "-2".
Percent Diff. subtracts Bear values from Bull values, then divides that difference by the sum of Bull and Bear values multiplied by 100. If a Bull value was "3" and Bear value was "7", the difference would be "-4", the sum would be "10", and the Percent Diff. would be "-40", as the difference is both bearish and 40% of total.
Ratio Norm. Threshold
This is the third data transformation . While quotients can be less than 1, directional ratios are never less than 1. This can lead to barcode-like artifacts as plots transition between positive and negative values, visually suggesting the change is much larger than it actually is. Normalizing the data can resolve this artifact, but undermines the utility of ratios. If, however, only some of the data is normalized, the artifact can be resolved without jeopardizing its contextual usefulness.
The utility of ratios is how quickly they communicate proportional differences. For example, if one side is twice as big as the other, "2" communicates this efficiently. This necessarily means the numerical value of ratios is worth preserving. Also, below a certain threshold, the utility of ratios is diminished. For example, an equal distribution being represented as 0, 1, 1:1, 50/50, etc. are all equally useful. Thus, there is a threshold, above which we want values to be exact, and below which the utility of linear visual continuity is more important. This setting accounts for that threshold.
When this setting is enabled, a ratio will be normalized to 0 when 1:1, scaled linearly toward the specified threshold when greater than 1:1, and then retain its exact value when the threshold is crossed. For example, with a threshold of "2", 1:1 = 0, 1.5:1 = 1, 2:1 = 2, 3:1 = 3, etc.
With all this in mind, most traders will want to set the ratios threshold at a level where accuracy becomes more important than visual continuity. If this level is unknown, "2" is a good baseline.
Reset cumulative total with each new session
Cumulative totals can be retained indefinitely or be reset each session. When enabled, each session has its own cumulative total. When disabled, the cumulative total is maintained indefinitely.
Show Signal Ranges
Because everything in this script is designed to make identifying sentiment extremes easier, an obvious inclusion would be to not only display ranges that are considered extreme for each Market Internal, but to also change the color of the plot when it is within, or beyond, that range. That is exactly what this setting does.
Override Max & Min
While the min-max signal levels have reasonable defaults for each symbol and transformation type, the Override Max and Override Min options allow you to … (wait for it) … override the max … and min … signal levels. This may be useful should you find a different level to be more suitable for your exact configuration.
Reduce Noise
This is the fourth data transformation . While the previous Ratio Norm. Threshold linearly stretches values between a threshold and 0, this setting will exponentially squash values closer to 0 if below the lower signal level.
The purpose of this is to compress data below the signal range, then amplify it as it approaches the signal level. If we are trying to identify extremes (the signal), minimizing values that are not extreme (the noise) can help us visually focus on what matters.
Always keep both signal zones visible
Some traders like to zoom in close to the bars. Others prefer to keep a wider focus. For those that like to zoom in, if both signals were always visible, the bar values can appear squashed and difficult to discern. For those that keep a wider focus, if both signals were not always visible, it's possible to lose context if a signal zone is vertically beyond the pane. This setting allows you to decide which scenario is best for you.
Plot Colors
These define the default color, within signal color, and beyond signal color for Bullish and Bearish directions.
Plot colors should be relative to zero
When enabled, the plot will inherit Bullish colors when above zero and Bearish colors when below zero. When disabled and Directional Colors are enabled (below), the plot will inherit the default Bullish color when rising, and the default Bearish color when falling. Otherwise, the plot will use the default Bullish color for all directions.
Directional colors
When the plot colors should be relative to zero (above), this changes the opacity of a bars color if moving toward zero, where "100" percent is the full value of the original color and "0" is transparent. When the plot colors are NOT relative to zero, the plot will inherit Bullish colors when rising and Bearish colors when falling.
Differentiate RTH from ETH
Market Internal data is typically only available during regular trading hours. When this setting is enabled, the background color of the indicator will change as a reminder that data is not available outside regular trading hours (RTH), if the chart is showing electronic trading hours (ETH).
Show zero line
Similar to always keeping signal zones visible (further up), some traders prefer zooming in while others prefer a wider context. This setting allows you to specify the visibility of the zero line to best suit your trading style.
Linear Regression
Polynomial regressions are great for capturing non-linear patterns in data. TradingView offers a "linear regression curve", which this script is using as a substitute. If you're unfamiliar with either term, think of this like a better moving average.
Symbol
While the Market Internal symbol will display in the status line of the indicator, the status line can be small and require more than a quick glance to read properly. Enabling this setting allows you to specify if / where / how the symbol should display on the indicator to make distinguishing between Market Internals more efficient.
Speaking of symbols, this indicator is designed for, and limited to, the following …
TICK - The TICK subtracts the total number of stocks making a downtick from the total number of stocks making an uptick.
ADD - The Advance Decline Difference subtracts the total number of stocks below yesterdays close from the total number of stocks above yesterdays close.
VOLD - The Volume Difference subtracts the total declining volume from the total advancing volume.
TRIN - The Arms Index (aka. Trading Index) divides the ratio of Advancing Stocks / Volume by the ratio of Declining Stocks / Volume. Given the inverse correlation of this index to market movement, when transforming it to a Ratio or Percent Diff., its values are inverted to preserve the bull-bear sentiment of the transformations.
VIX - The CBOE Volatility Index is derived from SPX index option prices, generating a 30-day forward projection of volatility. Given the inverse correlation of this index to market movement, when transforming it to a Ratio or Percent Diff., its values are inverted and normalized to the sessions first bar to preserve the bull-bear sentiment of the transformations. Note: If you do not have a Cboe CGIF subscription , VIX data will be delayed and plot unexpectedly.
ABVD - The Above VWAP Difference is an unofficial index measuring all stocks above VWAP as a percent difference. For the purposes of this indicator (and brevity), TradingViews PCTABOVEVWAP has has been shortened to simply be ABVD.
TKCD - The Tick Cumulative Difference is an unofficial index that subtracts the total number of market downticks from the total number of market upticks. Where "the TICK" (further up) is a measurement of stocks ticking up and down, TKCD is a measurement of the ticks themselves. For the purposes of this indicator (and brevity), TradingViews UPTKS and DNTKS symbols have been shorted to simply be TKCD.
INSPIRATION
I recently made an indicator automatically identifying / drawing daily percentage levels , based on 4 assumptions. One of these assumptions is about trend days. While trend days do not represent the majority of days, they can have big moves worth understanding, for both capitalization and risk mitigation.
To this end, I discovered:
• Article by Linda Bradford Raschke about Capturing Trend Days.
• Video of Garrett Drinon about Trend Day Trading.
• Videos of Ryan Trost about How To Use ADD and TICK.
• Article by Jason Ruchel about Overview of Key Market Internals.
• Including links to resources outside of TradingView violates the House Rules, but they're not hard to find, if interested.
These discoveries inspired me adopt the underlying symbols in my own trading. I also found myself wanting to make using them easier, the net result being this script.
While coding everything, I also discovered a few symbols I believe warrant serious consideration. Specifically the Percent Above VWAP symbols and the Up Ticks / Down Ticks symbols (referenced as ABVD and TKCD in this indicator, for brevity). I found transforming ABVD or TKCD into a Ratio or Percent Diff. to be an incredibly useful and worthy inclusion.
ABVD is a Market Breadth cousin to Brian Shannon's work, and TKCD is like the 3rd dimension of the TICKs geometry. Enjoy.

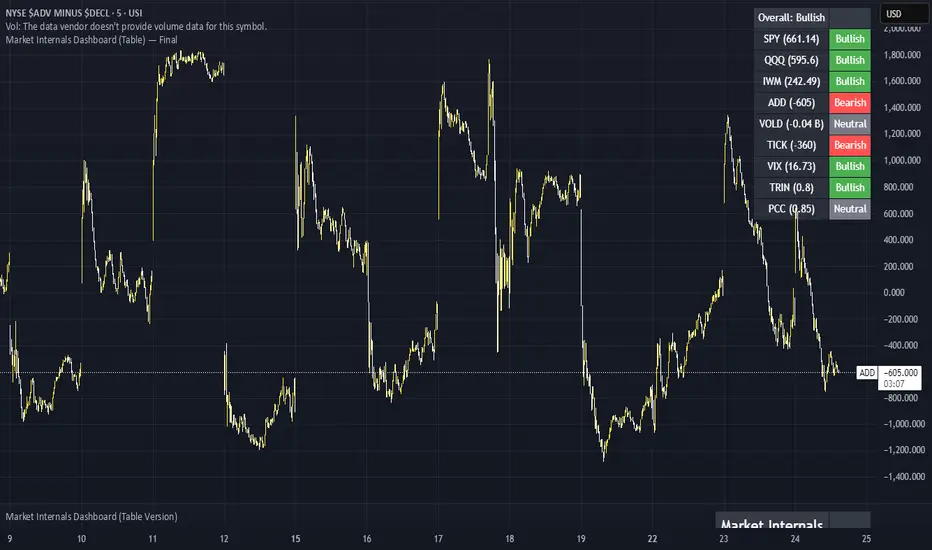
Market Internals Dashboard: Trend, Breadth, Volume PressureOverview
The Market Internals Dashboard Pro is a professional-grade toolkit modeled after what prop firms and institutional desks use to understand real intraday market conditions.
Instead of relying solely on price, this indicator analyzes three critical internal forces:
USI:TICK : Microstructure buying/selling pressure
USI:ADD : Market breadth participation (advancers vs decliners proxy)
USI:VOLD : Volume pressure (buying vs selling volume)
These internals determine whether the market is:
Trending or ranging
Bullish or bearish
Likely to follow through or mean-revert
Favoring continuation trades or fade setups
The script also produces a Market Environment Score (–3 to +3) and a real-time Trade Recommendation Table that updates every bar. This helps answer the single most important question in intraday trading: “What type of trades should I be taking right now given current market conditions?”
1. TICK Proxy: Microstructure Pressure
Measures buying vs. selling aggressiveness across the market This proxy simulates the NYSE TICK index by evaluating whether bars close above or below the prior bar.
Positive TICK → Buyers lifting offers
Negative TICK → Sellers hitting bids
Neutral TICK → No microstructure conviction
Why it matters:
Strong TICK is often the earliest sign of:
Trend initiation
Algorithmic buy/sell programs
Shifts in short‑term sentiment
Weak or choppy TICK often signals:
Range conditions
Failed breakouts
Low‑quality trend attempts
2. ADD Proxy: Market Breadth Strength
Shows how many stocks are participating in a move Because real USI:ADD data isn't available for all users, this script uses a self-contained breadth approximation built from:
Price slope
Volatility expansion
Volume‑weighted directional pressure
Why it matters? Breadth reveals whether the move is:
Broad and healthy → likely to continue
Narrow and weak → vulnerable to reversal
Strong trends require strong breadth. Weak breadth often precedes:
Failed breakouts
Reversal setups
Chop (ewww)
3. VOLD Proxy: Volume Pressure
The most important internal of all. This proxy measures whether trading volume is flowing into up bars or down bars.
Positive VOLD → Net buying pressure
Negative VOLD → Net selling pressure
Why it matters:
VOLD is considered the "truth serum" of the tape:
Strong VOLD drives trend days
Negative VOLD kills long setups
Mixed VOLD creates chop
You should rarely trend trade against VOLD.
4. Market Environment Score (–3 to +3)
The Environment Score combines the three internals into a single view:
|| Score || Interpretation || Market Type ||
| +3 | Strong Bull | Trend Day (Long) |
| +2 | Bull | Pullback Buys / Breakout Continuation |
| +1 | Mild Bull | Conservative Long Scalps |
| 0 | Neutral | CHOP – VWAP Reversions / Fades |
| -1 | Mild Bear | Short Failed Breakouts |
| -2 | Bear | Trend Shorts / Breakdown Continuation |
| -3 | Strong Bear | Trend Day (Short) |
Why it matters:
The market behaves differently depending on internal alignment. This score prevents traders from:
Forcing trend trades on chop days
Chasing breakouts when breadth is weak
Fading strong directional days
It tells you in real time whether conditions favor:
Trend following
Mean reversion
Breakout continuation
Liquidity grabs
Or sitting out
5. Trade Recommendation Engine
Based on the Environment Score, the indicator outputs a real-time playbook recommending which trade types have the highest probability of success right now.
Examples:
Score = 0 (Neutral)
VWAP Reversions
Liquidity Grabs
Failed Breakouts
Quick Scalps
Score = +2/+3 (Strong Bull)
Pullback Buys
Breakout Continuation
Trend Longs
Score = -2/-3 (Strong Bear)
Pullback Shorts
Breakdown Continuation
Trend Shorts Only
This turns the internals into a trade selection engine, not just a data display.
Why Market Internals Matter
Most indicators look only at price, but price is the result, not the cause.
Market internals show:
Where volume is flowing
Whether buying is aggressive or passive
How many stocks are participating
Whether algorithms are supporting or fighting the move
This dashboard helps traders:
Avoid chop
Stay out of low‑quality setups
Time entries with institutional flows
Improve win rate by trading the right setups at the right times
Final Notes
Works on any symbol or timeframe
Fully customizable colors
Two clean visual tables: Internals + Trade Playbook
Ideal for futures, ETFs, and options day traders
If you enjoy this tool, please like, comment, or follow. More enhancements are coming.
Trade smart.

Market Internals & InfoThis script provides various information on Market Internals and other related info. It was a part of the Daily Levels script but that script was getting very large so I decided to separate this piece of it into its own indicator. I plan on adding some additional features in the near future so stay tuned for those!
The script provides customizability to show certain market internals, tickers, and even Market Profile TPO periods.
Here is a summary of each setting:
NASDAQ and NYSE Breadth Ratio
- Ratio between Up Volume and Down Volume for NASDAQ and NYSE markets. This can help inform about the type of volume flowing in and out of these exchanges.
Advance/Decline Line (ADL)
The ADL focuses specifically on the number of advancing and declining stocks within an index, without considering their trading volume.
Here's how the ADL works:
It tracks the daily difference between the number of stocks that are up in price (advancing) and the number of stocks that are down in price (declining) within a particular index.
The ADL is a cumulative measure, meaning each day's difference is added to the previous day's total.
If there are more advancing stocks, the ADL goes up.
If there are more declining stocks, the ADL goes down.
By analyzing the ADL, investors can get a sense of how many stocks are participating in a market move.
Here's what the ADL can tell you:
Confirmation of Trends: When the ADL moves in the same direction as the underlying index (e.g., ADL rising with a rising index), it suggests broad participation in the trend and potentially stronger momentum.
Divergence: If the ADL diverges from the index (e.g., ADL falling while the index is rising), it can be a warning sign. This suggests that fewer stocks are participating in the rally, which could indicate a weakening trend.
Keep in mind:
The ADL is a backward-looking indicator, reflecting past market activity.
It's often used in conjunction with other technical indicators for a more complete picture.
TRIN Arms Index
The TRIN index, also called the Arms Index or Short-Term Trading Index, is a technical analysis tool used in the stock market to gauge market breadth and sentiment. It essentially compares the number of advancing stocks (gaining in price) to declining stocks (losing price) along with their trading volume.
Here's how to interpret the TRIN:
High TRIN (above 1.0): This indicates a weak market where declining stocks and their volume are dominating the market. It can be a sign of a potential downward trend.
Low TRIN (below 1.0): This suggests a strong market where advancing stocks and their volume are in control. It can be a sign of a potential upward trend.
TRIN around 1.0: This represents a more balanced market, where it's difficult to say which direction the market might be headed.
Important points to remember about TRIN:
It's a short-term indicator, primarily used for intraday trading decisions.
It should be used in conjunction with other technical indicators for a more comprehensive market analysis. High or low TRIN readings don't guarantee future price movements.
VIX/VXN
VIX and VXN are both indexes created by the Chicago Board Options Exchange (CBOE) to measure market volatility. They differ based on the underlying index they track:
VIX (Cboe Volatility Index): This is the more well-known index and is considered the "fear gauge" of the stock market. It reflects the market's expectation of volatility in the S&P 500 index over the next 30 days.
VXN (Cboe Nasdaq Volatility Index): This is a counterpart to the VIX, but instead gauges volatility expectations for the Nasdaq 100 index over the coming 30 days. The tech-heavy Nasdaq can sometimes diverge from the broader market represented by the S&P 500, hence the need for a separate volatility measure.
Both VIX and VXN are calculated based on the implied volatilities of options contracts listed on their respective indexes. Here's a general interpretation:
High VIX/VXN: Indicates a high level of fear or uncertainty in the market, suggesting investors expect significant price fluctuations in the near future.
Low VIX/VXN: Suggests a more complacent market with lower expectations of volatility.
Important points to remember about VIX and VXN:
They are forward-looking indicators, reflecting market sentiment about future volatility, not necessarily current market conditions.
High VIX/VXN readings don't guarantee a market crash, and low readings don't guarantee smooth sailing.
These indexes are often used by investors to make decisions about portfolio allocation and hedging strategies.
Inside/Outside Day
This provides a quick indication of it we are still trading inside or outside of yesterdays range and will show "Inside Day" or "Outside Day" based upon todays range vs. yesterday's range.
Custom Ticker Choices
Ability to add up to 5 other tickers that can be tracked within the table
Show Market Profile TPO
This only shows on timeframes less than 30m. It will show both the current TPO period and the remaining time within that period.
Table Customization
Provided drop downs to change the text size and also the location of the table.

Market Internals Dashboard (Table) v5 - FixedHas a Dashboard for Market Internals and 3 Indices, very helpful
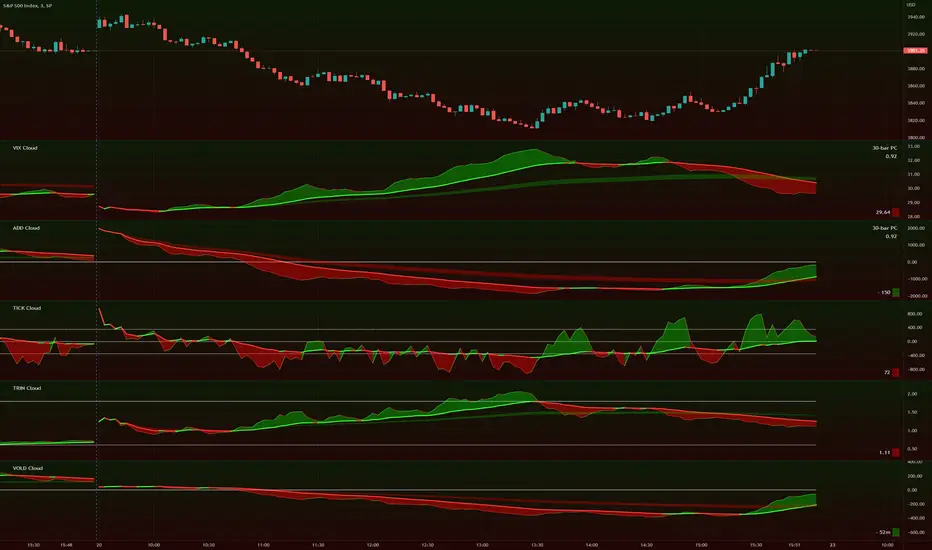
TIG's Market Internals Clouds Indicator v2.0=================================
== GENERAL INTRODUCTION
=================================
If you find market internals inform your intraday trading decisions (SPX, ES futures, SPY or more generally) this may be helpful.
Currently available internals are:
- ADD
- TICK
- TRIN
- VIX
- VOLD
Also, you can display your favorite alternative market internal (or BTC, if you want?!) by entering the relevant ticker in the 'Custom' field
=================================
== NOTES
=================================
The default EMA lengths seem to work reasonably well for 1, 2, 3-minute timeframes (except for TICK - you may wish to apply a bit more smoothing to TICK to reduce the noise)
Of course; you can add this indicator to your chart multiple times, and display a different internal each time.
The default Text Color is set as a mid-grey, which is readable in both TV color schemes. I prefer dark mode, and so I change the text color to white. You can't see the scheme setting from within a script, unfortunately, so this can't be automated.
=================================
== EXPERIMENTAL FEATURE
=================================
As a free bonus, the indicator can display the 30-bar (default) Pearson Correlation Coefficient between the internal, and price action (based on the super-fast EMA, to give a bit of smoothing). This may give a clue as to whether or not the market is aligned with what the internal is doing, or if the market (today) is not correlated with the particular internal.
Very roughly speaking:
- 0.50 means that 50% of the price action can be explained by reference to the internal. This is about the same level of correlation between VIX and Actual Move
- 0.80 suggests pretty strong correlation
I don't know why (yet) but sometimes this works, and sometimes it doesn't display a sensible figure.
=================================
== QUESTIONS AND FEEDBACK
=================================
If you have any general questions about market internals, Google is your friend.
If you have any specific queries, bug reports, feature requests or general feedback about this indicator please leave a comment below, and I'll get back to you ASAP!
TICK & ADD Market Internals SuiteOverview: This is the ultimate Market Internals tool designed for professional SPX/ES and NQ intraday traders.
Traders often monitor both TICK (for short-term timing) and ADD (for daily trend context). However, displaying them on the same chart is usually problematic due to their different scales (TICK ±1000 vs. ADD ±2000), causing chart compression.
Market Internals Suite solves this with a smart "Visual Scaling" algorithm, perfectly fusing TICK Candles and the ADD Line into a single, coherent pane.
Key Features
1.Hybrid Visualization:
· TICK (Foreground): Displayed as OHLC Candles to capture instant liquidity sweeps and wicks.
· ADD (Background): Displayed as a clean Line to show the underlying market breadth trend without clutter.
2.Smart Visual Scaling:
· To prevent chart distortion, the ADD line is visually scaled down (Default Ratio: 1.5).
· This aligns the ADD trend volatility with the TICK range, allowing you to instantly spot divergences or resonance between sentiment and trend.
3.Real-Time Data Dashboard:
· Never lose track of the actual numbers. A dashboard in the top-right corner displays the TRUE values for both TICK and ADD (unscaled).
· Customizable Text Size: You can adjust the dashboard font size (Small/Normal/Large/Huge) in the settings to fit your screen.
4.TICK Extreme Alerts:
· Visual Highlight: The chart background highlights (Green/Red) only when TICK hits the extreme ±1000 levels.
· The ADD line remains clean and alert-free to serve as a stable reference.
Strategy: Context + Timing:
1.Trend Resonance
When the ADD line trends upward and TICK candles consistently maintain levels above zero, it indicates a healthy, strong trend. This is a signal to look for trend-following long setups.
2.Divergence Analysis (The "Holy Grail" Signal)
This combination view makes spotting internal divergences incredibly easy:
· Bearish Divergence: When Price makes a New High, but the ADD line or TICK peaks make a Lower High. This suggests buying exhaustion beneath the surface and often precedes a reversal down.
· Bullish Divergence: When Price makes a New Low, but the ADD line or TICK lows make a Higher Low. This suggests that selling pressure is being absorbed, signaling a potential bounce or reversal up.

Market Internals: VolumeThe indicator plots the total volume of the NYSE and NASDAQ exchanges and identifies periods with significant asymmetry between Up Volume and Down Volume. It can be used as an additional tool to confirm broad market sentiment.
Chart shows Total Volume (TVOL) bars for SPY daily chart. Green bars for UVOL>>DVOL, Red for DVOL>>UVOL. Neutral bars are gray. Blue line shows median TVOL.
Rationale:
Up Volume (UVOL) and Down Volume (DVOL) represent the total volume of stocks that have increased or decreased in price, respectively, compared to the previous session's closing price. The magnitude of the price change is irrelevant.
When UVOL is significantly higher than DVOL, it indicates a prevailing buying sentiment in the broad market. Conversely, when DVOL is higher, it signals prevailing selling sentiment.
Occasionally, the UVOL/DVOL (VOLD) ratio may be misaligned with the movement of the S&P index. The picture below illustrates an example of a day when the S&P declined, yet the UVOL was twice larger than DVOL. Such a divergence can suggest that the S&P was pulled down by a decline in a few large-cap stocks, while the broader market remained positive. In this case, the divergence led to a continuation of the rally.
Thus, VOLD, when combined with volume analysis, can be an effective tool for confirming market trends.
Parameters:
VOLD Ratio – minimum ratio of UVOL/DVOL or DVOL/UVOL. Indicator will color code volume columns when condition is true (“green” means buying; “red” selling).
Median Length – number of periods to calculate median TVOL.
Show Divergencies – indicator marks divergencies between price and volume sentiments on the main chart. Only works for SPY chart.
Users can also choose which exchanges (NASDAQ/NYSE) to use for volume calculation.
Notes:
Volume is shown in millions of contracts
Indicator should be used on the daily or higher timeframes. It won't work properly on the intraday charts
Disclaimer
This indicator should not be used as a standalone tool to make trading decisions but only in conjunction with other technical analysis methods.

Market Energy & Direction DashboardMarket Energy & Direction Dashboard - Daytrading
Overview
A comprehensive real-time market internals dashboard that combines NYSE TICK, NYSE Advance-Decline (ADD) momentum, VIX direction, and relative volume into a single visual traffic light system with intelligent signal synthesis. Designed for active daytraders who need instant confirmation of market direction and energy based on momentum alignment across all major internals.
What It Does
This indicator synthesizes multiple market internals using directional momentum analysis rather than static thresholds to provide clear, actionable signals:
• Traffic Light System: Single glance confirmation of market state
o Bright Green: Maximum bullish - all internals aligned (TICK + ADD rising + VIX falling + volume)
o Bright Red: Maximum bearish - all internals aligned (TICK + ADD falling + VIX rising + volume)
o Yellow: Exhaustion warning - TICK at extremes, potential reversal imminent
o Moderate Colors: Partial alignment - some confirmation but not complete
o Gray: Choppy, neutral, or conflicting signals
• Real-Time Dashboard displays:
o Current TICK value with exhaustion warnings
o Current ADD with directional momentum indicator (↑ rising = breadth improving, ↓ falling = breadth deteriorating, ± compression)
o VIX level with directional indicator (↓ declining = bullish, ↑ rising = bearish, ± compression = neutral)
o Relative volume (current vs 20-period average)
o Composite status message synthesizing all data into clear directional summary
Key Features
✓ Momentum-based analysis - all indicators show direction/change, not just levels ✓ Intelligent signal hierarchy from "Maximum" to "Moderate" based on internal alignment ✓ ADD directional momentum - catches breadth shifts early, works in all market conditions ✓ VIX directional analysis - shows if fear is increasing, decreasing, or stagnant ✓ Color-coded traffic light for instant decision making ✓ Detects TICK/ADD divergences (conflicting signals = caution) ✓ Exhaustion warnings at extreme TICK levels (±1000+) ✓ Composite status messages - "Maximum Bull", "Strong Bull", "Moderate Bull", etc. ✓ Customizable thresholds for all parameters ✓ Moveable dashboard (9 position options) ✓ Built-in alerts for all signal strengths, exhaustion, and divergences
How To Use
Setup:
1. Add indicator to your main trading chart (SPY, ES, NQ, etc.)
2. Default settings work well for most traders, but you can customize:
o TICK Extreme Level (default 1000)
o ADD Compression Threshold (default 100 - detects when breadth is stagnant)
o VIX Elevated Level (default 20)
o VIX Compression Threshold (default 2% - detects low volatility)
o Volume Threshold (default 1.5x average)
3. Position dashboard wherever convenient on your chart
Reading The Signals:
Signal Hierarchy (Strongest to Weakest):
MAXIMUM SIGNALS ⭐ (Brightest colors - All 4 internals aligned)
• "✓ MAXIMUM BULL": TICK bullish + ADD rising (↑) + VIX falling (↓) + Volume elevated
o This is the holy grail setup - all momentum aligned, highest conviction longs
• "✓ MAXIMUM BEAR": TICK bearish + ADD falling (↓) + VIX rising (↑) + Volume elevated
o Perfect storm bearish - all momentum aligned, highest conviction shorts
STRONG SIGNALS (Bright colors - Core internals aligned)
• "✓ STRONG BULL": TICK bullish + ADD rising (↑)
o Strong confirmation even without VIX/volume - breadth supporting the move
• "✓ STRONG BEAR": TICK bearish + ADD falling (↓)
o Strong confirmation - both momentum and breadth deteriorating
MODERATE SIGNALS (Faded colors - Partial confirmation)
• "MODERATE BULL": TICK bullish but ADD not confirming direction
o Proceed with caution - momentum present but breadth questionable
• "MODERATE BEAR": TICK bearish but ADD not confirming direction
o Proceed with caution - selling but breadth not fully participating
WARNING SIGNALS
• "⚠ EXHAUSTION" (Yellow): TICK at ±1000+ extremes
o Potential reversal zone - prepare to fade or take profits
o Often marks blow-off tops or capitulation bottoms
NEUTRAL/AVOID
• "CHOPPY/NEUTRAL" (Gray): Conflicting signals or low conviction
o Stay out or reduce size significantly
Individual Indicator Interpretation:
TICK:
• Green: Bullish momentum (>+300)
• Red: Bearish momentum (<-300)
• Yellow: Exhaustion (±1000+)
• Gray: Neutral
ADD (Advance-Decline):
• Green (↑): Breadth improving - more stocks participating in the move
• Red (↓): Breadth deteriorating - fewer stocks participating
• Gray (±): Breadth stagnant - no clear participation trend
VIX:
• Green (↓): Fear declining - healthy environment for rallies
• Red (↑): Fear rising - risk-off mode, supports downward moves
• Gray (±): Volatility compression - often precedes explosive moves
Volume:
• Green: High conviction (>1.5x average)
• Gray: Low conviction
Trading Strategy:
1. Wait for "MAXIMUM" or "STRONG" signals for highest probability entries
o Maximum signals = go full size with confidence
o Strong signals = good conviction, normal position sizing
2. Confirm directional alignment:
o For longs: Want ADD ↑ (rising) and VIX ↓ (falling)
o For shorts: Want ADD ↓ (falling) and VIX ↑ (rising)
3. Use exhaustion warnings (yellow) to:
o Take profits on existing positions
o Prepare counter-trend entries
o Tighten stops
4. Avoid "MODERATE" signals unless you have strong conviction from other analysis
o These work best as confirmation for existing setups
o Not strong enough to initiate new positions alone
5. Never trade "CHOPPY/NEUTRAL" signals
o Gray means stay out - preserve capital
o Wait for clear alignment
6. Watch for divergences:
o Price making new highs but ADD ↓ (falling) = distribution warning
o Price making new lows but ADD ↑ (rising) = potential bottom
o Divergence alert will notify you
Best Practices:
• Use on 1-5 minute charts for daytrading
• Combine with your price action or technical setup (support/resistance, trendlines, patterns)
• The dashboard confirms when to take your setup, not what setup to take
• Most effective during regular market hours (9:30 AM - 4:00 PM ET) when volume is present
• The strongest edge comes from "MAXIMUM" signals - wait for these for best risk/reward
• Pay special attention to ADD direction - it's the most predictive breadth indicator
• VIX compression (gray ±) often signals upcoming volatility expansion - prepare for bigger moves
Customization Option
All thresholds are adjustable in settings:
• TICK Extreme: Higher = fewer exhaustion warnings (try 1200-1500 for less sensitivity)
• ADD Compression Threshold: Change detection sensitivity
o Default 100 = balanced
o Lower (50) = more sensitive to small breadth changes
o Higher (200-300) = only shows major breadth shifts
• VIX Elevated: Adjust for current volatility regime (15-25 typical range)
• VIX Compression Threshold:
o Default 2% = balanced
o Lower (0.5-1%) = catches subtle VIX changes
o Higher (3-5%) = only shows significant VIX moves
• Volume Threshold: Lower for quieter stocks/times, higher for more confirmation
Alerts Available
• Maximum Bullish: All 4 internals aligned bullish (TICK + ADD↑ + VIX↓ + Volume)
• Maximum Bearish: All 4 internals aligned bearish (TICK + ADD↓ + VIX↑ + Volume)
• Strong Bullish: TICK bullish + ADD rising
• Strong Bearish: TICK bearish + ADD falling
• Exhaustion Warning: TICK at extreme levels
• Divergence Warning: TICK and ADD directions conflicting
Understanding the Signal Synthesis
The indicator uses intelligent logic to combine all internals:
"MAXIMUM" Signals require:
• TICK direction (bullish/bearish)
• ADD momentum (rising/falling) in same direction
• VIX direction (falling for bulls, rising for bears)
• Volume elevated (>1.5x average)
"STRONG" Signals require:
• TICK direction (bullish/bearish)
• ADD momentum (rising/falling) in same direction
• (VIX and volume are bonuses but not required)
"MODERATE" Signals:
• TICK showing direction
• But ADD not confirming or contradicting
• Weakest actionable signal
This hierarchy ensures you know exactly how much conviction the market has behind any move.
Technical Details
• Pulls real-time data from NYSE TICK (USI:TICK), NYSE ADD (USI:ADD), and CBOE VIX
• ADD direction calculated using bar-to-bar change with compression detection
• VIX direction calculated using bar-to-bar percentage change
• Volume calculation uses 20-period simple moving average
• Dashboard updates every bar
• No repainting - all calculations based on closed bar data
Who This Is For
• Active daytraders of stocks, futures (ES/NQ), and options
• Scalpers needing quick directional confirmation with multiple internal alignment
• Swing traders looking to time intraday entries with maximum confluence
• Volatility traders who monitor VIX behavior
• Market makers and professionals who trade based on breadth and internals
• Anyone who monitors market internals but wants intelligent synthesis vs raw data
Tips For Success
Trading Philosophy:
• Quality over quantity - wait for "MAXIMUM" signals for best results
• One "MAXIMUM" signal trade is worth five "MODERATE" signal trades
• Gray/neutral is not a sign of missing opportunity - it's protecting your capital
Signal Confidence Levels:
1. MAXIMUM (95%+ confidence) - Trade these aggressively with full size
2. STRONG (80-85% confidence) - Trade these with normal position sizing
3. MODERATE (60-70% confidence) - Only if confirmed by strong technical setup
4. CHOPPY/NEUTRAL - Do not trade, wait for clarity
Advanced Techniques:
• Breadth divergences: Watch for price making new highs while ADD shows ↓ (falling) = major warning
• VIX/Price divergences: Rallies with rising VIX (↑) are usually false moves
• Volume confirmation: "MAXIMUM" signals with 2x+ volume are the absolute best
• Compression zones: When both ADD and VIX show compression (±), expect explosive breakout soon
• Sequential signals: Back-to-back "MAXIMUM" signals in same direction = strong trending day
Common Patterns:
• Opening surge with "MAXIMUM BULL" that shifts to "EXHAUSTION" (yellow) = fade the high
• Selloff with "MAXIMUM BEAR" followed by ADD ↑ (rising) divergence = potential reversal
• Choppy morning followed by "MAXIMUM" signal afternoon = best trending opportunity
Example Scenarios
Perfect Bull Entry:
• Bright green signal box
• TICK: +650
• ADD: +1200 (↑)
• VIX: 18.30 (↓)
• Volume: 2.3x
• Status: "✓ MAXIMUM BULL" → ALL SYSTEMS GO - Take aggressive long positions
Strong Bull (Good Confidence):
• Green signal box (slightly less bright)
• TICK: +500
• ADD: +800 (↑)
• VIX: 19.50 (±)
• Volume: 1.2x
• Status: "✓ STRONG BULL" → Good long setup - breadth confirming even without VIX/volume
Caution Bull (Moderate):
• Faded green signal box
• TICK: +400
• ADD: +900 (↓)
• VIX: 20.10 (↑)
• Volume: 0.9x
• Status: "MODERATE BULL" → CAUTION - TICK bullish but breadth deteriorating and VIX rising = weak rally
Exhaustion Warning:
• Yellow signal box
• TICK: +1350 ⚠
• ADD: +2100 (↑)
• VIX: 17.20 (↓)
• Volume: 1.8x
• Status: "⚠ EXHAUSTION" → Take profits or prepare to fade - TICK overextended despite good internals
Divergence Setup (Potential Reversal):
• Faded green signal
• TICK: +300
• ADD: +1800 (↓)
• VIX: 21.50 (↑)
• Volume: 1.6x
• Status: "MODERATE BULL" → WARNING - Price rallying but breadth collapsing and fear rising = distribution
Perfect Bear Entry:
• Bright red signal box
• TICK: -780
• ADD: -1600 (↓)
• VIX: 24.80 (↑)
• Volume: 2.5x
• Status: "✓ MAXIMUM BEAR" → Perfect short setup - all momentum bearish with conviction
Compression (Wait Mode):
• Gray signal box
• TICK: +50
• ADD: -200 (±)
• VIX: 16.40 (±)
• Volume: 0.7x
• Status: "CHOPPY/NEUTRAL" → STAY OUT - Volatility compression, no conviction, await breakout
Performance Optimization
Best Market Conditions:
• Works excellent in trending markets (up or down)
• Particularly powerful during high-volume sessions (first/last hours)
• "MAXIMUM" signals most reliable during 9:45-11:00 AM and 2:00-3:30 PM ET
Less Effective During:
• Lunch period (11:30 AM - 1:30 PM) - lower volume reduces signal quality
• Low-volatility environments - compression signals dominate
• Major news events in first 5 minutes - wait for internals to stabilize
Recommended Use Cases:
• Scalping: Trade only "MAXIMUM" signals for quick 5-15 minute moves
• Daytrading: Use "MAXIMUM" and "STRONG" signals for position entries
• Swing entries: Use "MAXIMUM" signals for optimal intraday entry timing
• Exit timing: Use "EXHAUSTION" (yellow) warnings to take profits
________________________________________
Pro Tip: Create a dedicated workspace with this indicator on SPY/ES/NQ charts. Set alerts for "MAXIMUM BULL", "MAXIMUM BEAR", and "EXHAUSTION" signals. Most professional traders only trade the "MAXIMUM" setups and ignore everything else - this alone can dramatically improve win rates.

McClellan Indicators (Oscillator, Summation Index w/ RSI & MACD)Four indicators in one based on the McClellan Oscillator for both the NYSE and Nasdaq exchanges. Designed to be used in conjunction with each other- plot the Oscillator (Osc), Summation Index (MSI), and RSI/MACD of the MSI on both your SPX and Nasdaq chart. Select the exchange and indicator within the settings. These tools are secondary- but when the signals are combined with the action of the index and stocks can be helpful in identifying market turns and trend strength.
McClellan Oscillator--
The Osc is a market breadth tool that uses a fast and slow EMA based on the difference between advancing and declining stocks on the exchange. Used primarily to identify breadth thrusts, divergences, and extremes (oversold/overbought). Plot horizontal levels to see when the market internals are extremely overbought or oversold, and take note of when the Osc is declining while the market is advancing or vice versa.
McClellan Summation Index--
For intermediate trends the MSI is a running total of the Osc which can be used to confirm the strength of a trend, and spot potential reversals. A 10 period ema is included on this indicator, where crossovers can aid in spotting the change in trend of market internals, and divergences can identify when market internals are not in line with the trend. Shading is applied for when the internals are in a bullish or bearish trend.
Two additional indicators are the RSI and MACD of the Summation Index. An overbought or oversold MSI RSI generally indicates a strong trend in the market internals, however you may want to take note when the RSI stalls and begins to "hook" in the opposite direction. This indicator has signals to show when the market internals may be turning and to be on lookout for trend change.
Similarly- the MACD of the MSI identifies the strength of the trend, and crossovers can be used to help spot reversals. Shading is included in this indicator to spot the bullish/bearish trend of internals.

Internals Elite NYSE [Beta]Overview:
This indicator is designed to provide traders with a quick overview of key market internals and metrics in a single, easy-to-read table displayed directly on the chart. It incorporates a variety of metrics that help gauge market sentiment, momentum, and overall market conditions.
The table dynamically updates in real-time and uses color-coding to highlight significant changes or thresholds, allowing traders to quickly interpret the data and make informed trading decisions.
Features:
Market Internals:
TICK: Measures the difference between the number of stocks ticking up versus those ticking down on the NYSE. Green or red background indicates if it crosses a user-defined threshold.
Advance/Decline (ADD): Shows the net number of advancing versus declining stocks on the NYSE. Color-coded to show positive, negative, or neutral conditions.
Volatility Metrics:
VIX Change (%): Displays the percentage change in the Volatility Index (VIX), a key gauge of market fear or complacency. Color-coded for direction.
VIX Price: Displays the current VIX price with thresholds to indicate low, medium, or high volatility.
Other Market Metrics:
DXY Change (%): Percentage change in the US Dollar Index (DXY), indicating dollar strength or weakness.
VWAP Deviation (%): Percentage of stocks above VWAP (Volume Weighted Average Price), helping traders assess intraday buying and selling pressure.
Asset-Specific Metrics:
BTCUSD Change (%): Percentage change in Bitcoin (BTC) price, useful for monitoring cryptocurrency sentiment.
SPY Change (%): Percentage change in the S&P 500 ETF (SPY), a proxy for the overall stock market.
Current Ticker Change (%): Percentage change in the currently selected ticker on the chart.
US10Y Change (%): Percentage change in the yield of the 10-Year US Treasury Note (TVC:US10Y), an important macroeconomic indicator.
Customizable Appearance:
Adjustable text size to suit your chart layout.
User-defined thresholds for key metrics (e.g., TICK, ADD, VWAP, VIX).
Dynamic Table Placement:
You can position the table anywhere on the chart: top-right, top-left, bottom-right, bottom-left, middle-right, or middle-left.
How to Use:
Add the Indicator to Your Chart:
Apply the indicator to your chart from the Pine Script editor in TradingView.
Customize the Inputs:
Adjust the thresholds for TICK, ADD, VWAP, and VIX according to your trading style.
Enable or disable the metrics you want to see in the table by toggling the display options for each metric (e.g., Show TICK, Show BTC, Show SPY).
Set the table placement to your preferred position on the chart.
Interpret the Table:
Look for color-coded cells to quickly identify significant changes or breaches of thresholds.
Positive values are typically shown in green, negative values in red, and neutral/insignificant changes in gray.
Use metrics like TICK and ADD to gauge market breadth and momentum.
Refer to VWAP deviation to assess intraday buying or selling pressure.
Monitor the VIX and US10Y changes to stay aware of macroeconomic and volatility shifts.
Incorporate Into Your Strategy:
Use the indicator alongside technical analysis to confirm setups or identify areas of caution.
Keep an eye on correlated metrics (e.g., VIX and SPY) for broader market context.
Use BTCUSD or DXY as additional indicators of risk-on/risk-off sentiment.
Ideal Users:
Day Traders: Quickly gauge intraday market conditions and momentum.
Swing Traders: Identify broader sentiment shifts using metrics like ADD, DXY, and US10Y.
Macro Investors: Stay updated on key macroeconomic indicators like the 10-Year Treasury yield (US10Y) and the US Dollar Index (DXY).
This indicator serves as a comprehensive tool for understanding market conditions at a glance, enabling traders to act decisively based on the latest data.

Yelober_Momentum_BreadthMI# Yelober_Momentum_BreadthMI: Market Breadth Indicator Analysis
## Overview
The Yelober_Momentum_BreadthMI is a comprehensive market breadth indicator designed to monitor market internals across NYSE and NASDAQ exchanges. It tracks several key metrics including up/down volume ratios, TICK readings, and trend momentum to provide traders with real-time insights into market direction, strength, and potential turning points.
## Indicator Components
This indicator displays a table with data for:
- NYSE breadth metrics
- NASDAQ breadth metrics
- NYSE TICK data and trends
- NASDAQ TICK (TICKQ) data and trends
## Table Columns and Interpretation
### Column 1: Market
Identifies the data source:
- **NYSE**: New York Stock Exchange data
- **NASDAQ**: NASDAQ exchange data
- **Tick**: NYSE TICK index
- **TickQ**: NASDAQ TICK index
### Column 2: Ratio
Shows the current ratio values with different calculations depending on the row:
- **For NYSE/NASDAQ rows**: Displays the up/down volume ratio
- Positive values (green): More up volume than down volume
- Negative values (red): More down volume than up volume
- The magnitude indicates the strength of the imbalance
- **For Tick/TickQ rows**: Shows the ratio of positive to negative ticks plus the current TICK reading in parentheses
- Format: "Ratio (Current TICK value)"
- Positive values (green): More stocks ticking up than down
- Negative values (red): More stocks ticking down than up
### Column 3: Trend
Displays the directional trend with both a symbol and value:
- **For NYSE/NASDAQ rows**: Shows the VOLD (volume difference) slope
- "↗": Rising trend (positive slope)
- "↘": Falling trend (negative slope)
- "→": Neutral/flat trend (minimal slope)
- **For Tick/TickQ rows**: Shows the slope of the ratio history
- Color-coding: Green for positive momentum, Red for negative momentum, Gray for neutral
The trend column is particularly important as it shows the current momentum of the market. The indicator applies specific thresholds for color-coding:
- NYSE: Green when normalized value > 2, Red when < -2
- NASDAQ: Green when normalized value > 3.5, Red when < -3.5
- TICK/TICKQ: Green when slope > 0.01, Red when slope < -0.01
## How to Use This Indicator
### Basic Interpretation
1. **Market Direction**: When multiple rows show green ratios and upward trends, it suggests strong bullish market internals. Conversely, red ratios and downward trends indicate bearish internals.
2. **Market Breadth**: The magnitude of the ratios indicates how broad-based the market movement is. Higher absolute values suggest stronger market breadth.
3. **Momentum Shifts**: When trend arrows change direction or colors shift, it may signal a potential reversal or change in market momentum.
4. **Divergences**: Look for divergences between different markets (NYSE vs NASDAQ) or between ratios and trends, which can indicate potential market turning points.
### Advanced Usage
- **Volume Normalization**: The indicator includes options to normalize volume data (none, tens, thousands, millions, 10th millions) to handle different exchange scales.
- **Trend Averaging**: The slope calculation uses an averaging period (default: 5) to smooth out noise and identify more reliable trend signals.
## Examples for Interpretation
### Example 1: Strong Bullish Market
```
| Market | Ratio | Trend |
|--------|---------|-----------|
| NYSE | 1.75 | ↗ 2.85 |
| NASDAQ | 2.10 | ↗ 4.12 |
| Tick | 2.45 (485) | ↗ 0.05 |
| TickQ | 1.95 (320) | ↗ 0.03 |
```
**Interpretation**: All metrics are positive and trending upward (green), indicating a strong, broad-based rally. The high ratio values show significant bullish dominance. This suggests continuation of the upward move with good momentum.
### Example 2: Weakening Market
```
| Market | Ratio | Trend |
|--------|---------|-----------|
| NYSE | 0.45 | ↘ -1.50 |
| NASDAQ | 0.85 | → 0.30 |
| Tick | 0.95 (105) | ↘ -0.02 |
| TickQ | 1.20 (160) | → 0.00 |
```
**Interpretation**: The market is showing mixed signals with positive but low ratios, while NYSE and TICK trends are turning negative. NASDAQ shows neutral to slightly positive momentum. This divergence often occurs near market tops or during consolidation phases. Traders should be cautious and consider reducing position sizes.
### Example 3: Negative Market Turning Positive
```
| Market | Ratio | Trend |
|--------|---------|-----------|
| NYSE | -1.25 | ↗ 1.75 |
| NASDAQ | -0.95 | ↗ 2.80 |
| Tick | -1.35 (-250) | ↗ 0.04 |
| TickQ | -1.10 (-180) | ↗ 0.02 |
```
**Interpretation**: This is a potential bottoming pattern. Current ratios are still negative (red) showing overall negative breadth, but the trends are all positive (green arrows), indicating improving momentum. This divergence often occurs at market bottoms and could signal an upcoming reversal. Look for confirmation with price action before establishing long positions.
### Example 4: Mixed Market with Divergence
```
| Market | Ratio | Trend |
|--------|---------|-----------|
| NYSE | 1.45 | ↘ -2.25 |
| NASDAQ | -0.85 | ↘ -3.80 |
| Tick | 1.20 (230) | ↘ -0.03 |
| TickQ | -0.75 (-120) | ↘ -0.02 |
```
**Interpretation**: There's a significant divergence between NYSE (positive ratio) and NASDAQ (negative ratio), while all trends are negative. This suggests sector rotation or a market that's weakening but with certain segments still showing strength. Often seen during late-stage bull markets or in transitions between leadership groups. Consider reducing risk exposure and focusing on relative strength sectors.
## Practical Trading Applications
1. **Confirmation Tool**: Use this indicator to confirm price movements. Strong breadth readings in the direction of the price trend increase confidence in trade decisions.
2. **Early Warning System**: Watch for divergences between price and breadth metrics, which often precede market turns.
3. **Intraday Trading**: The real-time nature of TICK and volume data makes this indicator valuable for day traders to gauge intraday momentum shifts.
4. **Market Regime Identification**: Sustained readings can help identify whether the market is in a trend or chop regime, allowing for appropriate strategy selection.
This breadth indicator is most effective when used in conjunction with price action and other technical indicators rather than in isolation.

4C NYSE Market Breadth RatioThe NYSE Market Breadth Ratio is considered by some to be the “king” of market internals. It lets you know instantly how strong current buying or selling pressure is in the broad market, to eliminate guessing or opinion.
This indicator plots the Market Breadth Ratio values for the NYSE and the NASD exchanges in real time.
It also plots the NYSE Market Breadth Ratio in a histogram plot for visual reference.
The indicator dynamically changes colors between green and red depending on whether breadth is currently positive or negative.
This indicator divides the 'Up-Volume' ("UVOL") by 'Down-Volume' ("DVOL"), for each exchange.
It can be added to any chart, but is incredibly useful when added to other sources of market internals like the NYSE Advancers/Decliners Difference (ticker ADD) or with the NYSE UVOL / DVOL Difference (ticker VOLD ).
Credit goes to author=@auron9000 as the bulk of this code was from their Breadth Ratio Bubbles indicator.
---> The changes made to their indicator include: bug fixes where the values werent properly updating; fixed indicator to be a separate plot (not chart overlay), and added the histogram plot.

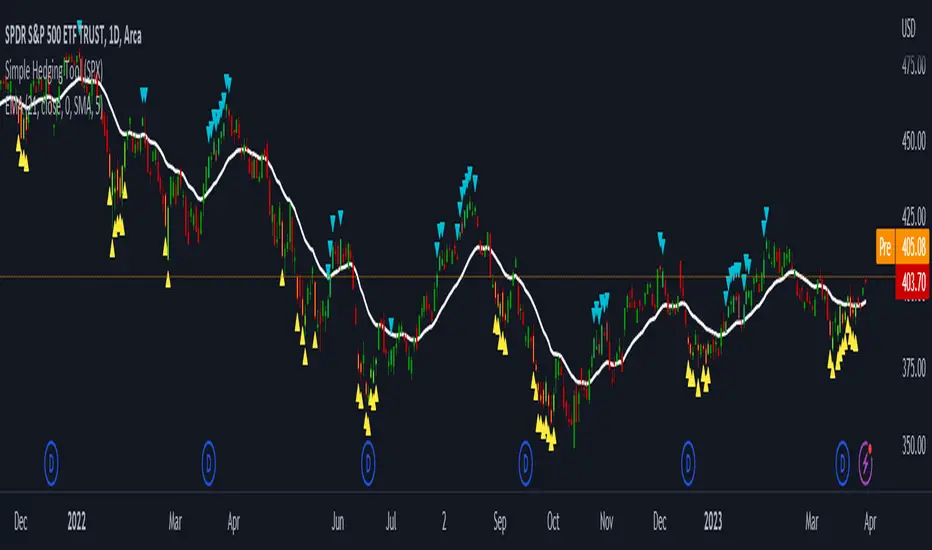
LNL Simple Hedging ToolLNL Simple Hedging Tool
Simple Hedging Tool was created specifically for swing traders who struggle with hedging. This tool helps to spot the ideal moments to put the hedges on (protection of the portfolio during "high risk" times). Simple Hedging Tool will not help you when day trading. It was designed for the daily charts. It is called simple because it is pretty much self-explanatory indicator. The candles are either blue or yellow. Meaning of the colors depend on the version you are using. This tool consist of two versions:
SPX Version:
This version was designed for indexes & overall market benchmarks. In contrast with the VIX version, the SPX version is little more sophisticated since it is based on key market internals. Blue arrows above the candles? More often than not this is signalizing that the key market internals are now approaching bearish signals which means it is the best time to hedge any bullish positions. On the contrary, the yellow arrows are the good reason to lighten up of the shorts & ease off the gas pedal on any bearish outlooks.
VIX Version:
Apart from the black swan events (big market crashes) Vix usually oscillates between the daily extremes. The VIX version is based on a simple bollinger band technique which is visualized with blue & yellow arrows. Whenever the yellow arrows & candles appear, it is good time to put the hedges on & perhaps lighten up on longs.
IMPORTANT DISCLAIMER:
The signals from this tool WILL NOT TELL YOU where to buy or sell! But rather when is a good time TO NOT buy or TO NOT sell. Once the signals appear it does not necessarily mean that the move is over & reversion willl happen immidiately. These signals can be flashing for days even weeks. They are not flashing for you to change the bias but rather tighten up your exposure in case your portfolio is mostly one sided.
Hope it helps.
Yelober - Market Internal direction+ Key levelsYelober – Market Internals + Key Levels is a focused intraday trading tool that helps you spot high-probability price direction by anchoring decisions to structure that matters: yesterday’s RTH High/Low, today’s pre-market High/Low, and a fast Value Area/POC from the prior session. Paired with a compact market internals dashboard (NYSE/NASDAQ UVOL vs. DVOL ratios, VOLD slopes, TICK/TICKQ momentum, and optional VIX trend), it gives you a real-time read on breadth so you can choose which direction to trade, when to enter (breaks, retests, or fades at PMH/PML/VAH/VAL/POC), and how to plan exits as internals confirm or deteriorate. On top of these intraday decision benefits, it also allows traders—in a very subtle but powerful way—to keep an eye on the VIX and immediately recognize significant spikes or sharp decreases that should be factored in before entering a trade, or used as a quick signal to modify an existing position. In short: clear levels for the chart, live internals for the context, and a smarter, rules-based path to execution.
# Yelober – Market Internals + Key Levels
*A TradingView indicator for session key levels + real‑time market internals (NYSE/NASDAQ TICK, UVOL/DVOL/VOLD, and VIX).*
**Script name in Pine:** `Yelober - Market Internal direction+ Key levels` (Pine v6)
---
## 1) What this indicator does
**Purpose:** Help intraday traders quickly find high‑probability reaction zones and read market internals momentum without switching charts. It overlays yesterday/today’s **automatic price levels** on your active chart and shows a **market breadth table** that summarizes NYSE/NASDAQ buying pressure and TICK direction, with an optional VIX trend read.
### Key features at a glance
* **Automatic Price Levels (overlay on chart)**
* Yesterday’s High/Low of Day (**yHoD**, **yLoD**)
* Extended Hours High/Low (**yEHH**, **yEHL**) across yesterday AH + today pre‑market
* Today’s Pre‑Market High/Low (**PMH**, **PML**)
* Yesterday’s **Value Area High/Low** (**VAH/VAL**) and **Point of Control (POC)** computed from a volume profile of yesterday’s **regular session**
* Smart de‑duplication:
* Shows **only the higher** of (yEHH vs PMH) and **only the lower** of (yEHL vs PML) to avoid redundant bands
* **Market Breadth Table (on‑chart table)**
* **NYSE ratio** = UVOL/DVOL (signed) with **VOLD slope** from session open
* **NASDAQ ratio** = UVOLQ/DVOLQ (signed) with **VOLDQ slope** from session open
* **TICK** and **TICKQ**: live cumulative ratio and short‑term slope
* **VIX** (optional): current value + slope over a configurable lookback/timeframe
* Color‑coded trends with sensible thresholds and optional normalization
---
## 2) How to use it (trader workflow)
1. **Mark your reaction zones**
* Watch **yHoD/yLoD**, **PMH/PML**, and **VAH/VAL/POC** for first touches, break/retest, and failure tests.
* Expect increased responsiveness when multiple levels cluster (e.g., PMH ≈ VAH ≈ daily pivot).
2. **Read the breadth panel for context**
* **NYSE/NASDAQ ratio** (>1 = more up‑volume than down‑volume; <−1 = down‑dominant). Strong green across both favors long setups; red favors short setups.
* **VOLD slopes** (NYSE & NASDAQ): positive and accelerating → broadening participation; negative → persistent pressure.
* **TICK/TICKQ**: cumulative ratio and **slope arrows** (↗ / ↘ / →). Use the slope to gauge **near‑term thrust or fade**.
* **VIX slope**: rising VIX (red) often coincides with risk‑off; falling VIX (green) with risk‑on.
3. **Confluence = higher confidence**
* Example: Price reclaims **PMH** while **NYSE/NASDAQ ratios** print green and **TICK slopes** point ↗ — consider break‑and‑go; if VIX slope is ↘, that adds risk‑on confidence.
* Example: Price rejects **VAH** while **VOLD slopes** roll negative and VIX ↗ — consider fade/reversal.
4. **Risk management**
* Place stops just beyond key levels tested; if breadth flips, tighten or exit.
> **Timeframes:** Works best on 1–15m charts for intraday. Value Area is computed from **yesterday’s RTH**; choose a smaller calculation timeframe (e.g., 5–15m) for stable profiles.
---
## 3) Inputs & settings (what each option controls)
### Global Style
* **Enable all automatic price levels**: master toggle for yHoD/yLoD, yEHH/yEHL, PMH/PML, VAH/VAL/POC.
* **Line style/width**: applies to all drawn levels.
* **Label size/style** and **label color linking**: use the same color as the line or override with a global label color.
* **Maximum bars lookback**: how far the script scans to build yesterday metrics (performance‑sensitive).
### Value Area / Volume Profile
* **Enable Value Area calculations** *(on by default)*: computes yesterday’s **POC**, **VAH**, **VAL** from a simplified intraday volume profile built from yesterday’s **regular session bars**.
* **Max Volume Profile Points** *(default 50)*: lower values = faster; higher = more precise.
* **Value Area Calculation Timeframe** *(default 15)*: the security timeframe used when collecting yesterday’s highs/lows/volumes.
### Individual Level Toggles & Colors
* **yHoD / yLoD** (yesterday high/low)
* **yEHH / yEHL** (yesterday AH + today pre‑market extremes)
* **PMH / PML** (today pre‑market extremes)
* **VAH / VAL / POC** (yesterday RTH value area + point of control)
### Market Breadth Panel
* **Show NYSE / NASDAQ / VIX**: choose which series to display in the table.
* **Table Position / Size / Background Color**: UI placement and legibility.
* **Slope Averaging Periods** *(default 5)*: number of recent TICK/TICKQ ratio points used in slope calculation.
* **Candles for Rate** *(default 10)* & **Normalize Rate**: VIX slope calculation as % change between `now` and `n` candles ago; normalize divides by `n`.
* **VIX Timeframe**: optionally compute VIX on a higher TF (e.g., 15, 30, 60) for a smoother regime read.
* **Volume Normalization** (NYSE & NASDAQ): display VOLD slopes scaled to `tens/thousands/millions/10th millions` for readable magnitudes; color thresholds adapt to your choice.
---
## 4) Data sources & definitions
* **UVOL/VOLD (NYSE)** and **UVOLQ/DVOLQ/VOLDQ (NASDAQ)** via `request.security()`
* **Ratio** = `UVOL/DVOL` (signed; negative when down‑volume dominates)
* **VOLD slope** ≈ `(VOLD_now − VOLD_open) / bars_since_open`, then normalized per your setting
* **TICK/TICKQ**: cumulative sum of prints this session with **positives vs negatives ratio**, plus a simple linear regression **slope** of the last `N` ratio values
* **VIX**: value and slope across a user‑selected timeframe and lookback
* **Sessions (EST/EDT)**
* **Regular:** 09:30–16:00
* **Pre‑Market:** 04:00–09:30
* **After Hours:** 16:00–20:00
* **Extended‑hours extremes** combine **yesterday AH** + **today PM**
> **Note:** All session checks are done with TradingView’s `time(…,"America/New_York")` context. If your broker’s RTH differs (e.g., futures), adjust expectations accordingly.
---
## 5) How the algorithms work (plain English)
### A) Key Levels
* **Yesterday’s RTH High/Low**: scans yesterday’s bars within 09:30–16:00 and records the extremes + bar indices.
* **Extended Hours**: scans yesterday AH and today PM to get **yEHH/yEHL**. Script shows **either yEHH or PMH** (whichever is **higher**) and **either yEHL or PML** (whichever is **lower**) to avoid duplicate bands stacked together.
* **Value Area & POC (RTH only)**
* Build a coarse volume profile with `Max Volume Profile Points` buckets across the price range formed by yesterday’s RTH bars.
* Distribute each bar’s volume uniformly across the buckets it spans (fast approximation to keep Pine within execution limits).
* **POC** = bucket with max volume. **VA** expands from POC outward until **70%** of cumulative volume is enclosed → yields **VAH/VAL**.
### B) Market Breadth Table
* **NYSE/NASDAQ Ratio**: signed UVOL/DVOL with basic coloring.
* **VOLD Slopes**: from session open to current, normalized to human‑readable units; colors flip green/red based on thresholds that map to your normalization setting (e.g., ±2M for NYSE, ±3.5×10M for NASDAQ).
* **TICK/TICKQ Slope**: linear regression over the last `N` ratio points → **↗ / → / ↘** with the rounded slope value.
* **VIX Slope**: % change between now and `n` candles ago (optionally divided by `n`). Red when rising beyond threshold; green when falling.
---
## 6) Recommended presets
* **Stocks (liquid, intraday)**
* Value Area **ON**, `Max Volume Points` = **40–60**, **Timeframe** = **5–15**
* Breadth: show **NYSE & NASDAQ & VIX**, `Slope periods` = **5–8**, `Candles for rate` = **10–20**, **Normalize VIX** = **ON**
* **Index futures / very high‑volume symbols**
* If you see Pine timeouts, set `Max Volume Points` = **20–40** or temporarily **disable Value Area**.
* Keep breadth panel **ON** (it’s light). Consider **VIX timeframe = 15/30** for regime clarity.
---
## 7) Tips, edge cases & performance
* **Performance:** The volume profile is capped (`maxBarsToProcess ≤ 500` and bucketed) to keep it responsive. If you experience slowdowns, reduce `Max Volume Points`, `Maximum bars lookback`, or disable Value Area.
* **Redundant lines:** The script **intentionally suppresses** PMH/PML when yEHH/yEHL are more extreme, and vice‑versa.
* **Label visibility:** Use `Label style = none` if you only want clean lines and read values from the right‑end labels.
* **Futures/RTH differences:** Value Area is from **yesterday’s RTH** only; for 24h instruments the RTH period may not reflect overnight structure.
* **Session transitions:** PMH/PML tracking stops as soon as RTH starts; values persist as static levels for the session.
---
## 8) Known limitations
* Uses public TradingView symbols: `UVOL`, `VOLD`, `UVOLQ`, `DVOLQ`, `VOLDQ`, `TICK`, `TICKQ`, `VIX`. If your data plan or region limits any symbol, the corresponding table rows may show `na`.
* The VA/POC approximation assumes uniform distribution of each bar’s volume across its high–low. That’s fast but not a tick‑level profile.
* Works best on US equities with standard NY session; alternative sessions may need code changes.
---
## 9) Troubleshooting
* **“Script is too slow / timed out”** → Lower `Max Volume Points`, lower `Maximum bars lookback`, or toggle **OFF** `Enable Value Area calculations` for that instrument.
* **Missing breadth values** → Ensure the symbols above load on your account; try reloading chart or switching timeframes once.
* **Overlapping labels** → Set `Label style = none` or reduce label size.
---
## 10) Version / license / contribution
* **Version:** Initial public release (Pine v6).
* **Author:** © yelober
* **License:** Free for community use and enhancement. Please keep author credit.
* **Contributing:** Open PRs/ideas: presets, alert conditions, multi‑day VA composites, optional mid‑value (`(VAH+VAL)/2`), session filter for futures, and alertable state machine for breadth regime transitions.
---
## 11) Quick start (TL;DR)
1. Add the indicator and **keep default settings**.
2. Trade **reactions** at yHoD/yLoD/PMH/PML/VAH/VAL/POC.
3. Use the **breadth table**: look for **green ratios + ↗ slopes** (risk‑on) or **red ratios + ↘ slopes** (risk‑off). Check **VIX** slope for confirmation.
4. Manage risk around levels; when breadth flips against you, tighten or exit.
---
### Changelog (public)
* **v1.0:** First community release with automatic RTH levels, VA/POC approximation, breadth dashboard (NYSE/NASDAQ/TICK/TICKQ/VIX) with normalization and adaptive color thresholds.

4C Data Table SuiteOverview
The 4C Data Table Suite is a versatile TradingView indicator, designed for traders who focus on the critical role of prior bar levels in their strategy. By highlighting the high and low points of previous bars, this tool aids in pinpointing crucial support and resistance zones, which often act as psychological triggers for market participants. The unique feature of this indicator is its dual-color coding: it colors bars green for bullish closes and red for bearish closes in the Prior Bar Table, and for the current timeframe, it highlights whether the current price is above (green) or below (red) these levels.
Concepts
1 — This sophisticated indicator is not just about visual cues; it provides a rich tableau of data including:
• Current timeframe countdown to bar close
• GMT-adjusted clock for precise trade timing
• Real-time updates on market internals and volatility measures such as the NYSE TICK and ATR
2 — The configuration is highly customizable, allowing users to:
• Adjust the table's positioning and text size
• Choose color settings for text, background, and borders to suit their visual preference
• Toggle the display of various data components based on their trading needs
3 — The Prior Bar Table is particularly valuable for:
• Traders using prior bar levels as triggers for trade entries and exits
• Quick visual assessment of market sentiment
• Real-time decision-making supported by dynamic color coding based on current price movements relative to prior highs and lows
Features
• Prior Bar Levels Table: Visualizes high and low levels of prior bars with intuitive color coding, aiding traders in assessing market trends.
• Dynamic Color Coding: Updates colors based on the closure of the previous bar and current price positions relative to the past bar's highs and lows.
• Comprehensive Market Data: Includes a suite of essential data such as market internals, the prior bar’s range, and the latest price information.
• Customizable Visuals: Offers extensive options for customizing the appearance and data presented, ensuring the tool fits seamlessly into any trader's strategy.
How to Use
1. To add the indicator, search for "4C Data Table Suite" under indicators on TradingView and apply it to your chart.
2. Navigate to the indicator settings to customize the display properties, including table position, color schemes, and which data points to display.
3. Utilize the toggles within the "Prior Bar Levels Table" settings to adjust the visibility and behavior of the table, depending on your trading approach.
Limitations
• This indicator is optimized for use on time-based charts and may not perform as intended on tick charts or non-standard timeframes.
• The color coding is based on the closure of bars, which may not always reflect intrabar movements, potentially affecting real-time decision-making in highly volatile markets.
Notes
• Ensure your TradingView interface is set to the correct timezone settings to align the GMT clock accurately.
• The dynamic color updates are designed to provide at-a-glance insights but should be used in conjunction with other analysis tools for best results.
*If you find that the indicator is blocking some of the candles at the bottom of the screen, go to (Chart) Settings, Canvas, and then adjust the Bottom/Top margin by increasing the % Amount.
Thanks
Special thanks to the TradingView community and developers whose feedback and insights have helped refine the functionalities of the 4C Data Table Suite. Your collaborative spirit is what makes continuous improvement possible.

Trading Dashboard + Daily SMAsThis indicator is an all-in-one workspace overlay designed for futures and intraday traders. It consolidates critical market internals, session statistics, and daily technical levels into a single, highly customizable dashboard.
The goal of this script is to reduce chart clutter by placing essential data into a clean table while overlaying key Daily Moving Averages onto your intraday timeframe.
Key Features:
1. Comprehensive Market Internals Dashboard Monitor the health of the broad market directly from your chart. The dashboard includes real-time data for:
VIX: Volatility Index.
TICK & TRIN: Sentiment and volume flow indicators.
Breadth Data: ADD, ADV, and DECL (Advance/Decline lines and volume).
Multi-Ticker Watch: Monitor 3 additional assets (Defaults: NQ, RTY, YM) with real-time price and % change.
2. Session Statistics & Probabilities Automated calculation of intraday statistics based on a user-defined lookback period (default 100 days):
RTH Data: Tracks Regular Trading Hours Open, Close, and Range.
Contextual ATR: Compares current RTH range to the 14-day ATR.
Probabilities: Displays historical probabilities for "Gap Fill," "Break of Yesterday's High," and "Break of Yesterday's Low."
3. Daily SMAs on Intraday Charts Plot key Daily Simple Moving Averages (21, 50, 200) directly on your lower timeframe charts (1m, 5m, etc.) without switching views.
Fully Customizable: Toggle each SMA on/off individually.
Color Control: Users can change the color of every SMA line to fit their theme.
4. "Dark Mode" Optimized The dashboard features a specific "Very Dark Grey" (#121212) background by default, designed to reduce eye strain and blend seamlessly with dark-themed trading setups.
Settings & Customization:
Session Times: Define your specific RTH start and end times.
Symbols: All ticker symbols (VIX, ADD, NQ, etc.) can be customized in the settings menu to match your data provider.
Visibility: Every element in the table and every SMA line has a toggle switch. You only see what you need.
Visuals: Change table position, text size, and line colors.
Author's Instructions: Configuration Guide
This script relies on specific ticker symbols to pull data for Market Internals (TICK, TRIN, ADD) and the Watchlist. Depending on your data subscription plan (CME, CBOE, etc.), you may need to adjust the default symbols to match what you have access to.
1. How to Change Symbols
Add the indicator to your chart.
Hover over the indicator name in the top-left corner and click the Settings (Gear Icon).
Scroll to the "Symbols" section.
Click inside the text box for the symbol you want to change.
2. Common Symbol Formats If the default symbols show "N/A" or "Error," try these alternatives based on your data feed:
TICK (NYSE Tick)
Default: USI:TICK (Requires specific data)
Alternative: TVC:TICK (General TradingView feed)
Alternative: TICK (Generic)
TRIN (Arms Index)
Default: USI:TRIN
Alternative: TVC:TRIN
Alternative: TRIN
Breadth (ADD/ADV/DECL)
ADD (Advance-Decline Line): Try USI:ADD, TVC:ADD, or ADD
ADV (Advancing Volume): Try USI:ADV, TVC:ADV, or UVOL (Up Volume)
DECL (Declining Volume): Try USI:DECL, TVC:DECL, or DVOL (Down Volume)
VIX
Standard: CBOE:VIX or TVC:VIX
3. Setting Up the Ticker Watchlist (Ticker 1, 2, 3) The script defaults to "Continuous Contracts" (indicated by the 1!), which automatically rolls to the front month.
Nasdaq: CME_MINI:NQ1!
S&P 500: CME_MINI:ES1!
Russell 2000: CME_MINI:RTY1!
Dow Jones: CBOT_MINI:YM1!
Note: If you want to watch a specific contract month (e.g., December 2025), enter the specific code like NQZ2025.
4. Troubleshooting "N/A" Data If a cell in the table is empty or says "N/A":
Verify you are not viewing the chart on a timeframe that excludes the data (though dynamic_requests=true usually handles this).
Ensure you have the correct data permission for that specific symbol.
Market Closed: Some internal data points only populate during the active NYSE session (09:30 - 16:00 ET).
Disclaimer: This tool is for informational purposes only and does not constitute financial advice. Past probabilities do not guarantee future results.

Indicator Based Market Exposure (IBME)The Indicator Based Market Exposure (IBME) system was created by Big Wave Chartist as a way to navigate the markets using a confluence of three different signals to determine when the "internals" of the market are in your favor and how heavily invested to be at any point. The idea of the system is also to flash warning signs when the market internals are beginning to deteriorate so as to take a defensive stance. Of course this system can be strictly adhered to, or it can be incorporated into a more discretionary style of trading, and be combined with progressive exposure into (and out of) the market as positions gain (or lose) traction.
The IBME displays a straightforward action signal based on the combination of the 3 separate signals:
Green 🟢 Full size-longs permitted
Yellow 🟡 Pilot positions permitted
Red 🔴 No longs allowed
So let's get into the signals used:
McClellan Summation Index
Net New Highs/Lows
Net New Highs Crossover
McClellan Summation Index (MSI)
The McClellan Summation Index is a long-term version of the McClellan Oscillator, which is a market breadth indicator based on stock advances and declines. Interpretation is similar to that of the McClellan Oscillator, except that it is more suited to intermediate to major trends and related reversals. The McClellan Summation Index can be calculated as the sum of all the daily values of the McClellan Oscillator. This is used along with the 10-sma to watch for a crossover indicating an uptrend or downtrend beginning.
Net New Highs/Lows
This is the net number of stocks making 52-week highs or lows. For instance, if there are 60 new 52-week highs and 20 new 52-week lows, the net number will be 40 net new 52 week highs. This signal is particularly useful in gauging breadth.
Net New Highs Crossover
This is the description of NNHC from the original separate version of this indicator created by HikoStory: "Net New Highs can guide you to increase or decrease your exposure based on the current market health. They are calculated by subtracting the new highs from the new lows, based on all stocks of the...NASDAQ. A positive value shows that the market is doing good, since more stocks are making new highs compared to new lows. A negative value shows that the market is doing bad, since more stocks are making new lows compared to new highs. Combined with a moving average you can see crossovers that can warn you early when there is a change in the current market health."
The default index for the IBME is the Nasdaq.
The IBME is meant to be used on a daily time frame chart, therefore the signal will only show on a daily time frame chart.
Display options include:
Show/hide individual signals
Table background/font color
Table size/placement

Smart Breadth [smartcanvas]Overview
This indicator is a market breadth analysis tool focused on the S&P 500 index. It visualizes the percentage of S&P 500 constituents trading above their 50-day and 200-day moving averages, integrates the McClellan Oscillator for advance-decline analysis, and detects various breadth-based signals such as thrusts, divergences, and trend changes. The indicator is displayed in a separate pane and provides visual cues, a summary label with tooltip, and alert conditions to highlight potential market conditions.
The tool uses data symbols like S5FI (percentage above 50-day MA), S5TH (percentage above 200-day MA), ADVN/DECN (S&P advances/declines), and optionally NYSE advances/declines for certain calculations. If primary data is unavailable, it falls back to calculated breadth from advance-decline ratios.
This indicator is intended for educational and analytical purposes to help users observe market internals. My intention was to pack in one indicator things you will only find in a few. It does not provide trading signals as financial advice, and users are encouraged to use it in conjunction with their own research and risk management strategies. No performance guarantees are implied, and historical patterns may not predict future market behavior.
Key Components and Visuals
Plotted Lines:
Aqua line: Percentage of S&P 500 stocks above their 50-day MA.
Purple line: Percentage of S&P 500 stocks above their 200-day MA.
Optional orange line (enabled via "Show Momentum Line"): 10-day momentum of the 50-day MA breadth, shifted by +50 for scaling.
Optional line plot (enabled via "Show McClellan Oscillator"): McClellan Oscillator, colored green when positive and red when negative. Can use actual scale or normalized to fit breadth percentages (0-100).
Horizontal Levels:
Dotted green at 70%: "Strong" level.
Dashed green at user-defined green threshold (default 60%): "Buy Zone".
Dashed yellow at user-defined yellow threshold (default 50%): "Neutral".
Dotted red at 30%: "Oversold" level.
Optional dotted lines for McClellan (when shown and not using actual scale): Overbought (red), Oversold (green), and Zero (gray), scaled to fit.
Background Coloring:
Green shades for bullish/strong bullish states.
Yellow for neutral.
Orange for caution.
Red for bearish.
Signal Shapes:
Rocket emoji (🚀) at bottom for Zweig Breadth Thrust trigger.
Green circle at bottom for recovery signal.
Red triangle down at top for negative divergence warning.
Green triangle up at bottom for positive divergence.
Light green triangle up at bottom for McClellan oversold bounce.
Green diamond at bottom for capitulation signal.
Summary Label (Right Side):
Displays current action (e.g., "BUY", "HOLD") with emoji, breadth percentages with colored circles, McClellan value with emoji, market state, risk/reward stars, and active signals.
Hover tooltip provides detailed breakdown: action priority, breadth metrics, McClellan status, momentum/trend, market state, active signals, data quality, thresholds, recent changes, and a general recommendation category.
Calculations and Logic
Breadth Percentages: Derived from S5FI/S5TH or calculated from advances/(advances + declines) * 100, with fallback adjustments.
McClellan Oscillator: Difference between fast (default 19) and slow (default 39) EMAs of net advances (advances - declines).
Momentum: 10-day change in 50-day MA breadth percentage.
Trend Analysis: Counts consecutive rising days in breadth to detect upward trends.
Breadth Thrust (Zweig): 10-day EMA of advances/total issues crossing from below a bottom level (default 40) to above a top level (default 61.5). Can use S&P or NYSE data.
Divergences: Compares S&P 500 price highs/lows with breadth or McClellan over a lookback period (default 20) to detect positive (bullish) or negative (bearish) divergences.
Market States: Determined by breadth levels relative to thresholds, trend direction, and McClellan conditions (e.g., strong bullish if above green threshold, rising, and McClellan supportive).
Actions: Prioritized logic (0-10) selects an action like "BUY" or "AVOID LONGS" based on signals, states, and conditions. Higher priority (e.g., capitulation at 10) overrides lower ones.
Alerts: Triggered on new occurrences of key conditions, such as breadth thrust, divergences, state changes, etc.
Input Parameters
The indicator offers customization through grouped inputs, but the use of defaults is encouraged.
Usage Notes
Add the indicator to a chart of any symbol (though designed around S&P 500 data; works best on daily or higher timeframes). Monitor the label and tooltip for a consolidated view of conditions. Set up alerts for specific events.
This script relies on external security requests, which may have data availability issues on certain exchanges or timeframes. The fallback mechanism ensures continuity but may differ slightly from primary sources.
Disclaimer
This indicator is provided for informational and educational purposes only. It does not constitute investment advice, financial recommendations, or an endorsement of any trading strategy. Market conditions can change rapidly, and users should not rely solely on this tool for decision-making. Always perform your own due diligence, consult with qualified professionals if needed, and be aware of the risks involved in trading. The author and TradingView are not responsible for any losses incurred from using this script.

NSE Swing Breadth NSE Swing Breadth – Market Health Dashboard (0–200, % from Neutral)
Overview
NSE Swing Breadth – Market Health Dashboard is a market-wide health and regime indicator designed to track internal strength and participation across Large-, Mid-, and Small-cap indices in the Indian equity market.
Instead of focusing on price alone, this tool measures how strongly each segment is behaving relative to its own swing trend, normalizes those movements, and combines them into a single Market Health score. The result is a clean, objective dashboard that helps traders identify Risk-On, Caution, and Risk-Off regimes.
This indicator is best used for position sizing, exposure control, and timing aggressiveness, rather than individual stock entries.
Data Used
The indicator internally tracks three broad NSE indices:
Large Caps → NIFTY100EQUALWEIGHT
Mid Caps → NIFTYMIDCAP150
Small Caps → NIFTYSMLCAP250
Using equal-weighted and broad indices ensures the signal reflects true market participation, not just index heavyweights.
Core Logic
1. Swing Strength Model
For each index, the script calculates normalized swing strength:
Price is compared to its EMA swing baseline
The deviation from the EMA is normalized using the EMA of absolute deviations
This creates a volatility-adjusted strength value, allowing fair comparison across market regimes
This answers the question:
Is this segment pushing meaningfully above or below its recent trend?
2. Strength Converted to % from Neutral (Baseline = 100)
Each segment’s strength is converted into percentage-style points around a neutral baseline of 100:
100 = Neutral
+15 = +15% strength above neutral
–20 = –20% weakness below neutral
These values are plotted as three smooth lines:
Blue → Large Caps
Orange → Mid Caps
Purple → Small Caps
This makes relative leadership and divergence immediately visible.
3. Market Health Score (0–100)
The indicator combines all three segments into a single Market Health score:
Large Caps → 40% weight
Mid Caps → 35% weight
Small Caps → 25% weight
Extreme values are clamped to avoid distortion, and the final score is normalized to a 0–100 scale:
70–100 → Strong, broad participation
40–69 → Mixed / unstable participation
0–39 → Weak, risk-off conditions
Visual Components
📊 Market Health Histogram
A vertical histogram displays Market Health (0–100) with enhanced visibility:
🟢 Green (≥ 70) → Strong Risk-On regime
🟠 Orange (40–69) → Caution / Transition
🔴 Red (< 40) → Risk-Off regime
The histogram is visually compact and designed to reflect true market health, not exaggerated spikes.
📈 Strength Lines (Baseline = 100)
Three strength lines show % deviation from neutral:
Above 100 → Positive internal strength
Below 100 → Internal weakness
These lines help identify:
Leadership (which segment is driving the market)
Early deterioration (small/mid caps weakening first)
Broad confirmation (all segments rising together)
Dashboard Tables
📌 Market Regime Table (Bottom-Left)
Displays the current market regime:
🟢 RISK ON
🟡 CAUTION
🔴 RISK OFF
Along with the exact Market Health score (0–100).
📌 Strength Table (Top-Right)
Shows Large / Mid / Small cap strength as % from neutral, for example:
+18% → 18% above neutral
–12% → 12% below neutral
This avoids misleading interpretations and keeps values intuitive and actionable.
How to Use This Indicator
Risk-On (Green)
Favor full position sizes, trend-following strategies, and broader participation trades.
Caution (Orange)
Reduce leverage, tighten stops, and be selective. Expect choppiness.
Risk-Off (Red)
Prioritize capital protection, reduce exposure, and avoid aggressive longs.
This indicator is not an entry signal — it is a market environment filter.
⚠️ Important Style Setting (Required)
For correct visualization:
Settings → Style → Uncheck “Labels on price scale”
This prevents the indicator’s internal 0–200 model scale from interfering with the chart’s price scale and keeps the pane clean and readable.
Summary
NSE Swing Breadth – Market Health Dashboard provides a clear, objective view of market internals, helping traders align their risk with the true underlying condition of the market — not just price movement.
It is especially effective for:
Market regime identification
Exposure management
Avoiding false breakouts in weak breadth environments

Enhanced Volume Trend Indicator with BB SqueezeEnhanced Volume Trend Indicator with BB Squeeze: Comprehensive Explanation
The visualization system allows traders to quickly scan multiple securities to identify high-probability setups without detailed analysis of each chart. The progression from squeeze to breakout, supported by volume trend confirmation, offers a systematic approach to identifying trading opportunities.
The script combines multiple technical analysis approaches into a comprehensive dashboard that helps traders make informed decisions by identifying high-probability setups while filtering out noise through its sophisticated confirmation requirements. It combines multiple technical analysis approaches into an integrated visual system that helps traders identify potential trading opportunities while filtering out false signals.
Core Features
1. Volume Analysis Dashboard
The indicator displays various volume-related metrics in customizable tables:
AVOL (After Hours + Pre-Market Volume): Shows extended hours volume as a percentage of the 21-day average volume with color coding for buying/selling pressure. Green indicates buying pressure and red indicates selling pressure.
Volume Metrics: Includes regular volume (VOL), dollar volume ($VOL), relative volume compared to 21-day average (RVOL), and relative volume compared to 90-day average (RVOL90D).
Pre-Market Data: Optional display of pre-market volume (PVOL), pre-market dollar volume (P$VOL), pre-market relative volume (PRVOL), and pre-market price change percentage (PCHG%).
2. Enhanced Volume Trend (VTR) Analysis
The Volume Trend indicator uses adaptive analysis to evaluate buying and selling pressure, combining multiple factors:
MACD (Moving Average Convergence Divergence) components
Volume-to-SMA (Simple Moving Average) ratio
Price direction and market conditions
Volume change rates and momentum
EMA (Exponential Moving Average) alignment and crossovers
Volatility filtering
VTR Visual Indicators
The VTR score ranges from 0-100, with values above 50 indicating bullish conditions and below 50 indicating bearish conditions. This is visually represented by colored circles:
"●" (Filled Circle):
Green: Strong bullish trend (VTR ≥ 80)
Red: Strong bearish trend (VTR ≤ 20)
"◯" (Hollow Circle):
Green: Moderate bullish trend (VTR 65-79)
Red: Moderate bearish trend (VTR 21-35)
"·" (Small Dot):
Green: Weak bullish trend (VTR 55-64)
Red: Weak bearish trend (VTR 36-45)
"○" (Medium Hollow Circle): Neutral conditions (VTR 46-54), shown in gray
In "Both" display mode, the VTR shows both the numerical score (0-100) alongside the appropriate circle symbol.
Enhanced VTR Settings
The Enhanced Volume Trend component offers several advanced customization options:
Adaptive Volume Analysis (volTrendAdaptive):
When enabled, dynamically adjusts volume thresholds based on recent market volatility
Higher volatility periods require proportionally higher volume to generate significant signals
Helps prevent false signals during highly volatile markets
Keep enabled for most trading conditions, especially in volatile markets
Speed of Change Weight (volTrendSpeedWeight, range 0-1):
Controls emphasis on volume acceleration/deceleration rather than absolute levels
Higher values (0.7-1.0): More responsive to new volume trends, better for momentum trading
Lower values (0.2-0.5): Less responsive, better for trend following
Helps identify early volume trends before they fully develop
Momentum Period (volTrendMomentumPeriod, range 2-10):
Defines lookback period for volume change rate calculations
Lower values (2-3): More responsive to recent changes, better for short timeframes
Higher values (7-10): Smoother, better for daily/weekly charts
Directly affects how quickly the indicator responds to new volume patterns
Volatility Filter (volTrendVolatilityFilter):
Adjusts significance of volume by factoring in current price volatility
High volume during high volatility receives less weight
High volume during low volatility receives more weight
Helps distinguish between genuine volume-driven moves and volatility-driven moves
EMA Alignment Weight (volTrendEmaWeight, range 0-1):
Controls importance of EMA alignments in final VTR calculation
Analyzes multiple EMA relationships (5, 10, 21 period)
Higher values (0.7-1.0): Greater emphasis on trend structure
Lower values (0.2-0.5): More focus on pure volume patterns
Display Mode (volTrendDisplayMode):
"Value": Shows only numerical score (0-100)
"Strength": Shows only symbolic representation
"Both": Shows numerical score and symbol together
3. Bollinger Band Squeeze Detection (SQZ)
The BB Squeeze indicator identifies periods of low volatility when Bollinger Bands contract inside Keltner Channels, often preceding significant price movements.
SQZ Visual Indicators
"●" (Filled Circle): Strong squeeze - high probability setup for an impending breakout
Green: Strong squeeze with bullish bias (likely upward breakout)
Red: Strong squeeze with bearish bias (likely downward breakout)
Orange: Strong squeeze with unclear direction
"◯" (Hollow Circle): Moderate squeeze - medium probability setup
Green: With bullish EMA alignment
Red: With bearish EMA alignment
Orange: Without clear directional bias
"-" (Dash): Gray dash indicates no squeeze condition (normal volatility)
The script identifies squeeze conditions through multiple methods:
Bollinger Bands contracting inside Keltner Channels
BB width falling to bottom 20% of recent range (BB width percentile)
Very narrow Keltner Channel (less than 5% of basis price)
Tracking squeeze duration in consecutive bars
Different squeeze strengths are detected:
Strong Squeeze: BB inside KC with tight BB width and narrow KC
Moderate Squeeze: BB inside KC with either tight BB width or narrow KC
No Squeeze: Normal market conditions
4. Breakout Detection System
The script includes two breakout indicators working in sequence:
4.1 Pre-Breakout (PBK) Indicator
Detects potential upcoming breakouts by analyzing multiple factors:
Squeeze conditions lasting 2-3 bars or more
Significant price ranges
Strong volume confirmation
EMA/MACD crossovers
Consistent price direction
PBK Visual Indicators
"●" (Filled Circle): Detected pre-breakout condition
Green: Likely upward breakout (bullish)
Red: Likely downward breakout (bearish)
Orange: Direction not yet clear, but breakout likely
"-" (Dash): Gray dash indicates no pre-breakout condition
The PBK uses sophisticated conditions to reduce false signals including minimum squeeze length, significant price movement, and technical confirmations.
4.2 Breakout (BK) Indicator
Confirms actual breakouts in progress by identifying:
End of squeeze or strong expansion of Bollinger Bands
Volume expansion
Price moving outside Bollinger Bands
EMA crossovers with volume confirmation
MACD crossovers with significant price range
BK Visual Indicators
"●" (Filled Circle): Confirmed breakout in progress
Green: Upward breakout (bullish)
Red: Downward breakout (bearish)
Orange: Unusual breakout pattern without clear direction
"◆" (Diamond): Special breakout conditions (meets some but not all criteria)
"-" (Dash): Gray dash indicates no breakout detected
The BK indicator uses advanced filters for confirmation:
Requires consecutive breakout signals to reduce false positives
Strong volume confirmation requirements (40% above average)
Significant price movement thresholds
Consistency checks between price action and indicators
5. Market Metrics and Analysis
Price Change Percentage (CHG%)
Displays the current percentage change relative to the previous day's close, color-coded green for positive changes and red for negative changes.
Average Daily Range (ADR%)
Calculates the average daily percentage range over a specified period (default 20 days), helping traders gauge volatility and set appropriate price targets.
Average True Range (ATR)
Shows the Average True Range value, a volatility indicator developed by J. Welles Wilder that measures market volatility by decomposing the entire range of an asset price for that period.
Relative Strength Index (RSI)
Displays the standard 14-period RSI, a momentum oscillator that measures the speed and change of price movements on a scale from 0 to 100.
6. External Market Indicators
QQQ Change
Shows the percentage change in the Invesco QQQ Trust (tracking the Nasdaq-100 Index), useful for understanding broader tech market trends.
UVIX Change
Displays the percentage change in UVIX, a volatility index, providing insight into market fear and potential hedging activity.
BTC-USD
Shows the current Bitcoin price from Coinbase, useful for traders monitoring crypto correlation with equities.
Market Breadth (BRD)
Calculates the percentage difference between ATHI.US and ATLO.US (high vs. low securities), indicating overall market direction and strength.
7. Session Analysis and Volume Direction
Session Detection
The script accurately identifies different market sessions:
Pre-market: 4:00 AM to 9:30 AM
Regular market: 9:30 AM to 4:00 PM
After-hours: 4:00 PM to 8:00 PM
Closed: Outside trading hours
This detection works on any timeframe through careful calculation of current time in seconds.
Buy/Sell Volume Direction
The script analyzes buying and selling pressure by:
Counting up volume when close > open
Counting down volume when close < open
Tracking accumulated volume within the day
Calculating intraday pressure (up volume minus down volume)
Enhanced AVOL Calculation
The improved AVOL calculation works in all timeframes by:
Estimating typical pre-market and after-hours volume percentages
Combining yesterday's after-hours with today's pre-market volume
Calculating this as a percentage of the 21-day average volume
Determining buying/selling pressure by analyzing after-hours and pre-market price changes
Color-coding results: green for buying pressure, red for selling pressure
This calculation is particularly valuable because it works consistently across any timeframe.
Customization Options
Display Settings
The dashboard has two customizable tables: Volume Table and Metrics Table, with positions selectable as bottom_left or bottom_right.
All metrics can be individually toggled on/off:
Pre-market data (PVOL, P$VOL, PRVOL, PCHG%)
Volume data (AVOL, RVOL Day, RVOL 90D, Volume, SEED_YASHALGO_NSE_BREADTH:VOLUME )
Price metrics (ADR%, ATR, RSI, Price Change%)
Market indicators (QQQ, UVIX, Breadth, BTC-USD)
Analysis indicators (Volume Trend, BB Squeeze, Pre-Breakout, Breakout)
These toggle options allow traders to customize the dashboard to show only the metrics they find most valuable for their trading style.
Table and Text Customization
The dashboard's appearance can be customized:
Table background color via tableBgColor
Text color (White or Black) via textColorOption
The indicator uses smart formatting for volume and price values, automatically adding appropriate suffixes (K, M, B) for readability.
MACD Configuration for VTR
The Volume Trend calculation incorporates MACD with customizable parameters:
Fast Length: Controls the period for the fast EMA (default 3)
Slow Length: Controls the period for the slow EMA (default 9)
Signal Length: Controls the period for the signal line EMA (default 5)
MACD Weight: Controls how much influence MACD has on the volume trend score (default 0.3)
These settings allow traders to fine-tune how momentum is factored into the volume trend analysis.
Bollinger Bands and Keltner Channel Settings
The Bollinger Bands and Keltner Channels used for squeeze detection have preset (hidden) parameters:
BB Length: 20 periods
BB Multiplier: 2.0 standard deviations
Keltner Length: 20 periods
Keltner Multiplier: 1.5 ATR
These settings follow standard practice for squeeze detection while maintaining simplicity in the user interface.
Practical Trading Applications
Complete Trading Strategies
1. Squeeze Breakout Strategy
This strategy combines multiple components of the indicator:
Wait for a strong squeeze (SQZ showing ●)
Look for pre-breakout confirmation (PBK showing ● in green or red)
Enter when breakout is confirmed (BK showing ● in same direction)
Use VTR to confirm volume supports the move (VTR ≥ 65 for bullish or ≤ 35 for bearish)
Set profit targets based on ADR (Average Daily Range)
Exit when VTR begins to weaken or changes direction
2. Volume Divergence Strategy
This strategy focuses on the volume trend relative to price:
Identify when price makes a new high but VTR fails to confirm (divergence)
Look for VTR to show weakening trend (● changing to ◯ or ·)
Prepare for potential reversal when SQZ begins to form
Enter counter-trend position when PBK confirms reversal direction
Use external indicators (QQQ, BTC, Breadth) to confirm broader market support
3. Pre-Market Edge Strategy
This strategy leverages pre-market data:
Monitor AVOL for unusual pre-market activity (significantly above 100%)
Check pre-market price change direction (PCHG%)
Enter position at market open if VTR confirms direction
Use SQZ to determine if volatility is likely to expand
Exit based on RVOL declining or price reaching +/- ADR for the day
Market Context Integration
The indicator provides valuable context for trading decisions:
QQQ change shows tech market direction
BTC price shows crypto market correlation
UVIX change indicates volatility expectations
Breadth measurement shows market internals
This context helps traders avoid fighting the broader market and align trades with overall market direction.
Timeframe Optimization
The indicator is designed to work across different timeframes:
For day trading: Focus on AVOL, VTR, PBK/BK, and use shorter momentum periods
For swing trading: Focus on SQZ duration, VTR strength, and broader market indicators
For position trading: Focus on larger VTR trends and use EMA alignment weight
Advanced Analytical Components
Enhanced Volume Trend Score Calculation
The VTR score calculation is sophisticated, with the base score starting at 50 and adjusting for:
Price direction (up/down)
Volume relative to average (high/normal/low)
Volume acceleration/deceleration
Market conditions (bull/bear)
Additional factors are then applied, including:
MACD influence weighted by strength and direction
Volume change rate influence (speed)
Price/volume divergence effects
EMA alignment scores
Volatility adjustments
Breakout strength factors
Price action confirmations
The final score is clamped between 0-100, with values above 50 indicating bullish conditions and below 50 indicating bearish conditions.
Anti-False Signal Filters
The indicator employs multiple techniques to reduce false signals:
Requiring significant price range (minimum percentage movement)
Demanding strong volume confirmation (significantly above average)
Checking for consistent direction across multiple indicators
Requiring prior bar consistency (consecutive bars moving in same direction)
Counting consecutive signals to filter out noise
These filters help eliminate noise and focus on high-probability setups.
MACD Enhancement and Integration
The indicator enhances standard MACD analysis:
Calculating MACD relative strength compared to recent history
Normalizing MACD slope relative to volatility
Detecting MACD acceleration for stronger signals
Integrating MACD crossovers with other confirmation factors
EMA Analysis System
The indicator uses a comprehensive EMA analysis system:
Calculating multiple EMAs (5, 10, 21 periods)
Detecting golden cross (10 EMA crosses above 21 EMA)
Detecting death cross (10 EMA crosses below 21 EMA)
Assessing price position relative to EMAs
Measuring EMA separation percentage
Recent Enhancements and Evolution
Version 5.2 includes several improvements:
Enhanced AVOL to show buying/selling direction through color coding
Improved VTR with adaptive analysis based on market conditions
AVOL display now works in all timeframes through sophisticated estimation
Removed animal symbols and streamlined code with bright colors for better visibility
Improved anti-false signal filters throughout the system
Optimizing Indicator Settings
For Different Market Types
Range-Bound Markets:
Lower EMA Alignment Weight (0.2-0.4)
Higher Speed of Change Weight (0.8-1.0)
Focus on SQZ and PBK signals for breakout potential
Trending Markets:
Higher EMA Alignment Weight (0.7-1.0)
Moderate Speed of Change Weight (0.4-0.6)
Focus on VTR strength and BK confirmations
Volatile Markets:
Enable Volatility Filter
Enable Adaptive Volume Analysis
Lower Momentum Period (2-3)
Focus on strong volume confirmation (VTR ≥ 80 or ≤ 20)
For Different Asset Classes
Equities:
Standard settings work well
Pay attention to AVOL for gap potential
Monitor QQQ correlation
Futures:
Consider higher Volume/RVOL weight
Reduce MACD weight slightly
Pay close attention to SQZ duration
Crypto:
Higher volatility thresholds may be needed
Monitor BTC price for correlation
Focus on stronger confirmation signals
Integrated Visual System for Trading Decisions
The colored circle indicators create an intuitive visual system for quick market assessment:
Progression Sequence: SQZ (Squeeze) → PBK (Pre-Breakout) → BK (Breakout)
This sequence often occurs in order, with the squeeze leading to pre-breakout conditions, followed by an actual breakout.
VTR (Volume Trend): Provides context about the volume supporting these movements.
Color Coding: Green for bullish conditions, red for bearish conditions, and orange/gray for neutral or undefined conditions.

Physics CandlesPhysics Candles embed volume and motion physics directly onto price candles or market internals according to the cyclic pattern of financial securities. The indicator works on both real-time “ticks” and historical data using statistical modeling to highlight when these values, like volume or momentum, is unusual or relatively high for some periodic window in time. Each candle is made out of one or more sub-candles that each contain their own information of motion, which converts to the color and transparency, or brightness, of that particular candle segment. The segments extend throughout the entire candle, both body and wicks, and Thick Wicks can be implemented to see the color coding better. This candle segmentation allows you to see if all the volume or energy is evenly distributed throughout the candle or highly contained in one small portion of it, and how intense these values are compared to similar time periods without going to lower time frames. Candle segmentation can also change a trader’s perspective on how valuable the information is. A “low” volume candle, for instance, could signify high value short-term stopping volume if the volume is all concentrated in one segment.
The Candles are flexible. The physics information embedded on the candles need not be from the same price security or market internal as the chart when using the Physics Source option, and multiple Candles can be overlayed together. You could embed stock price Candles with market volume, market price Candles with stock momentum, market structure with internal acceleration, stock price with stock force, etc. My particular use case is scalping the SPX futures market (ES), whose price action is also dictated by the volume action in the associated cash market, or SPY, as well as a host of other securities. Physics allows you to embed the ES volume on the SPY price action, or the SPY volume on the ES price action, or you can combine them both by overlaying two Candle streams and increasing the Number of Overlays option to two. That option decreases the transparency levels of your coloring scheme so that overlaying multiple Candles converges toward the same visual color intensity as if you had one. The Candle and Physics Sources allows for both Symbols and Spreads to visualize Candle physics from a single ticker or some mathematical transformation of tickers.
Due to certain TradingView programming restrictions, each Candle can only be made out of a maximum of 8 candle segments, or an “8-bit” resolution. Since limits are just an opportunity to go beyond, the user has the option to stack multiple Candle indicators together to further increase the candle resolution. If you don’t want to see the Candles for some particular period of the day, you can hide them, or use the hiding feature to have multiple Candles calibrated to show multiple parts of the trading day. Securities tend to have low volume after hours with sharp spikes at the open or close. Multiple Candles can be used for multiple parts of the trading day to accommodate these different cycles in volume.
The Candles do not need be associated with the nominal security listed on the TV chart. The Candle Source allows the user to look at AAPL Candles, for instance, while on a TSLA or SPY chart, each with their respective volume actions integrated into the candles, for instance, to allow the user to see multiple security price and volume correlation on a single chart.
The physics information currently embeddable on Candles are volume or time, velocity, momentum, acceleration, force, and kinetic energy. In order to apply equations of motion containing a mass variable to financial securities, some analogous value for mass must be assumed. Traders often regard volume or time as inextricable variables to a securities price that can indicate the direction and strength of a move. Since mass is the inextricable variable to calculating the momentum, force, or kinetic energy of motion, the user has the option to assume either time or volume is analogous to mass. Volume may be a better option for mass as it is not strictly dependent on the speed of a security, whereas time is.
Data transformations and outlier statistics are used to color code the intensity of the physics for each candle segment relative to past periodic behavior. A million shares during pre-market or a million shares during noontime may be more intense signals than a typical million shares traded at the open, and should have more intense color signals. To account for a specific cyclic behavior in the market, the user can specify the Window and Cycle Time Frames. The Window Time Frame splits up a Cycle into windows, samples and aggregates the statistics for each window, then compares the current physics values against past values in the same window. Intraday traders may benefit from using a Daily Cycle with a 30-minute Window Time Frame and 1-minute Sample Time Frame. These settings sample and compare the physics of 1-minute candles within the current 30-minute window to the same 30-minute window statistics for all past trading days, up until the data limit imposed by TradingView, or until the Data Collection Start Date specified in the settings. Longer-term traders may benefit from using a Monthly Cycle with a Weekly Time Frame, or a Yearly Cycle with a Quarterly Time Frame.
Multiple statistics and data transformation methods are available to convey relative intensity in different ways for different trading signals. Physics Candles allows for both Normal and Log-Normal assumptions in the physics distribution. The data can then be transformed by Linear, Logarithmic, Z-Score, or Power-Law scoring, where scoring simply assigns an intensity to the relative physics value of each candle segment based on some mathematical transformation. Z-scoring often renders adequate detection by scoring the segment value, such as volume or momentum, according to the mean and standard deviation of the data set in each window of the cycle. Logarithmic or power-law transformation with a gamma below 1 decreases the disparity between intensities so more less-important signals will show up, whereas the power-law transformation with gamma values above 1 increases the disparity between intensities, so less more-important signals will show up. These scores are then converted to color and transparency between the Min Score and the Max Score Cutoffs. The Auto-Normalization feature can automatically pick these cutoffs specific to each window based on the mean and standard deviation of the data set, or the user can manually set them. Physics was developed with novices in mind so that most users could calibrate their own settings by plotting the candle segment distributions directly on the chart and fiddling with the settings to see how different cutoffs capture different portions of the distribution and affect the relative color intensities differently. Security distributions are often skewed with fat-tails, known as kurtosis, where high-volume segments for example, have a higher-probabilities than expected for a normal distribution. These distribution are really log-normal, so that taking the logarithm leads to a standard bell-shaped distribution. Taking the Z-score of the Log-Normal distribution could make the most statistical sense, but color sensitivity is a discretionary preference.
Background Philosophy
This indicator was developed to study and trade the physics of motion in financial securities from a visually intuitive perspective. Newton’s laws of motion are loosely applied to financial motion:
“A body remains at rest, or in motion at a constant speed in a straight line, unless acted upon by a force”.
Financial securities remain at rest, or in motion at constant speed up or down, unless acted upon by the force of traders exchanging securities.
“When a body is acted upon by a force, the time rate of change of its momentum equals the force”.
Momentum is the product of mass and velocity, and force is the product of mass and acceleration. Traders render force on the security through the mass of their trading activity and the acceleration of price movement.
“If two bodies exert forces on each other, these forces have the same magnitude but opposite directions.”
Force arises from the interaction of traders, buyers and sellers. One body of motion, traders’ capitalization, exerts an equal and opposite force on another body of motion, the financial security. A securities movement arises at the expense of a buyer or seller’s capitalization.
Volume
The premise of this indicator assumes that volume, v, is an analogous means of measuring physical mass, m. This premise allows the application of the equations of motion to the movement of financial securities. We know from E=mc^2 that mass has energy. Energy can be used to create motion as kinetic energy. Taking a simple hypothetical example, the interaction of one short seller looking to cover lower and one buyer looking to sell higher exchange shares in a security at an agreed upon price to create volume or mass, and therefore, potential energy. Eventually the short seller will actively cover and buy the security from the previous buyer, moving the security higher, or the buyer will actively sell to the short seller, moving the security lower. The potential energy inherent in the initial consolidation or trading activity between buy and seller is now converted to kinetic energy on the subsequent trading activity that moves the securities price. The more potential energy that is created in the consolidation, the more kinetic energy there is to move price. This is why point and figure traders are said to give price targets based on the level of volatility or size of a consolidation range, or why Gann traders square price and time, as time is roughly proportional to mass and trading activity. The build-up of potential energy between short sellers and buyers in GME or TSLA led to their explosive moves beyond their standard fundamental valuations.
Position
Position, p, is simply the price or value of a financial security or market internal.
Time
Time, t, is another means of measuring mass to discover price behavior beyond the time snapshots that simple candle charts provide. We know from E=mc^2 that time is related to rest mass and energy given the speed of light, c, where time ≈ distance * sqrt(mass/E). This relation can also be derived from F=ma. The more mass there is, the longer it takes to compute the physics of a system. The more energy there is, the shorter it takes to compute the physics of a system. Similarly, more time is required to build a “resting” low-volatility trading consolidation with more mass. More energy added to that trading consolidation by competing buyers and sellers decreases the time it takes to build that same mass. Time is also related to price through velocity.
Velocity = (p(t1) – p(t0)) / p(t0)
Velocity, v, is the relative percent change of a securities price, p, over a period of time, t0 to t1. The period of time is between subsequent candles, and since time is constant between candles within the same timeframe, it is not used to calculate velocity or acceleration. Price moves faster with higher velocity, and slower with slower velocity, over the same fixed period of time. The product of velocity and mass gives momentum.
Momentum = mv
This indicator uses physics definition of momentum, not finance’s. In finance, momentum is defined as the amount of change in a securities price, either relative or absolute. This is definition is unfortunate, pun intended, since a one dollar move in a security from a thousand shares traded between a few traders has the exact same “momentum” as a one dollar move from millions of shares traded between hundreds of traders with everything else equal. If momentum is related to the energy of the move, momentum should consider both the level of activity in a price move, and the amount of that price move. If we equate mass to volume to account for the level of trading activity and use physics definition of momentum as the product of mass and velocity, this revised definition now gives a thousand-times more momentum to a one-dollar price move that has a thousand-times more volume behind it. If you want to use finance’s volume-less definition of momentum, use velocity in this indicator.
Acceleration = v(t1) – v(t0)
Acceleration, a, is the difference between velocities over some period of time, t0 to t1. Positive acceleration is necessary to increase a securities speed in the positive direction, while negative acceleration is necessary to decrease it. Acceleration is related to force by mass.
Force = ma
Force is required to change the speed of a securities valuation. Price movements with considerable force have considerably more impact on future direction. A change in direction requires force.
Kinetic Energy = 0.5mv^2
Kinetic energy is the energy that a financial security gains from the change in its velocity by force. The built-up of potential energy in trading consolidations can be converted to kinetic energy on a breakout from the consolidation.
Cycle Theory and Relativity
Just as the physics of motion is relative to a point of reference, so too should the physics of financial securities be relative to a point of reference. An object moving at a 100 mph towards another object moving in the same direction at 100 mph will not appear to be moving relative to each other, nor will they collide, but from an outsider observer, the objects are going 100 mph and will collide with significant impact if they run into a stationary object relative to the observer. Similarly, trading with a hundred thousand shares at the open when the average volume is a couple million may have a much smaller impact on the price compared to trading a hundred thousand shares pre-market when the average volume is ten thousand shares. The point of reference used in this indicator is the average statistics collected for a given Window Time Frame for every Cycle Time Frame. The physics values are normalized relative to these statistics.
Examples
The main chart of this publication shows the Force Candles for the SPY. An intense force candle is observed pre-market that implicates the directional overtone of the day. The assumption that direction should follow force arises from physical observation. If a large object is accelerating intensely in a particular direction, it may be fair to assume that the object continues its direction for the time being unless acted upon by another force.
The second example shows a similar Force Candle for the SPY that counters the assumption made in the first example and emphasizes the importance of both motion and context. While it’s fair to assume that a heavy highly accelerating object should continue its course, if that object runs into an obstacle, say a brick wall, it’s course may deviate. This example shows SPY running into the 50% retracement wall from the low of Mar 2020, a significant support level noted in literature. The example also conveys Gann’s idea of “lost motion”, where the SPY penetrated the 50% price but did not break through it. A brick wall is not one atom thick and price support is not one tick thick. An object can penetrate only one layer of a wall and not go through it.
The third example shows how Volume Candles can be used to identify scalping opportunities on the SPY and conveys why price behavior is as important as motion and context. It doesn’t take a brick wall to impede direction if you know that the person driving the car tends to forget to feed the cats before they leave. In the chart below, the SPY breaks down to a confluence of the 5-day SMA, 20-day SMA, and an important daily trendline (not shown) after the bullish bounce from the 50% retracement days earlier. High volume candles on the SMA signify stopping volume that reverse price direction. The character of the day changes. Bulls become more aggressive than bears with higher volume on upswings and resistance, whiles bears take on a defensive position with lower volume on downswings and support. High volume stopping candles are seen after rallies, and can tell you when to take profit, get out of a position, or go short. The character change can indicate that its relatively safe to re-enter bullish positions on many major supports, especially given the overarching bullish theme from the large reaction off the 50% retracement level.
The last example emphasizes the importance of relativity. The Volume Candles in the chart below are brightest pre-market even though the open has much higher volume since the pre-market activity is much higher compared to past pre-markets than the open is compared to past opens. Pre-market behavior is a good indicator for the character of the day. These bullish Volume Candles are some of the brightest seen since the bounce off the 50% retracement and indicates that bulls are making a relatively greater attempt to bring the SPY higher at the start of the day.
Infrequently Asked Questions
Where do I start?
The default settings are what I use to scalp the SPY throughout most of the extended trading day, on a one-minute chart using SPY volume. I also overlay another Candle set containing ES future volume on the SPY price structure by setting the Physics Source to ES1! and the Number of Overlays setting to 2 for each Candle stream in order to account for pre- and post-market trading activity better. Since the closing volume is exponential-like up until the end of the regular trading day, adding additional Candle streams with a tighter Window Time Frame (e.g., 2-5 minute) in the last 15 minutes of trading can be beneficial. The Hide feature can allow you to set certain intraday timeframes to hide one Candle set in order to show another Candle set during that time.
How crazy can you get with this indicator?
I hope you can answer this question better. One interesting use case is embedding the velocity of market volume onto an internal market structure. The PCTABOVEVWAP.US is a market statistic that indicates the percent of securities above their VWAP among US stocks and is helpful for determining short term trends in the US market. When securities are rising above their VWAP, the average long is up on the day and a rising PCTABOVEVWAP.US can be viewed as more bullish. When securities are falling below their VWAP, the average short is up on the day and a falling PCTABOVEVWAP.US can be viewed as more bearish. (UPVOL.US - DNVOL.US) / TVOL.US is a “spread” symbol, in TV parlance, that indicates the decimal percent difference between advancing volume and declining volume in the US market, showing the relative flow of volume between stocks that are up on the day, and stocks that are down on the day. Setting PCTABOVEVWAP.US in the Candle Source, (UPVOL.US - DNVOL.US) / TVOL.US in the Physics Source, and selecting the Physics to Velocity will embed the relative velocity of the spread symbol onto the PCTABOVEVWAP.US candles. This can be helpful in seeing short term trends in the US market that have an increasing amount of volume behind them compared to other trends. The chart below shows Volume Candles (top) and these Spread Candles (bottom). The first top at 9:30 and second top at 10:30, the high of the day, break down when the spread candles light up, showing a high velocity volume transfer from up stocks to down stocks.
How do I plot the indicator distribution and why should I even care?
The distribution is visually helpful in seeing how different normalization settings effect the distribution of candle segments. It is also helpful in seeing what physics intensities you want to ignore or show by segmenting part of the distribution within the Min and Max Cutoff values. The intensity of color is proportional to the physics value between the Min and Max Cutoff values, which correspond to the Min and Max Colors in your color scheme. Any physics value outside these Min and Max Cutoffs will be the same as the Min and Max Colors.
Select the Print Windows feature to show the window numbers according to the Cycle Time Frame and Window Time Frame settings. The window numbers are labeled at the start of each window and are candle width in size, so you may need to zoom into to see them. Selecting the Plot Window feature and input the window number of interest to shows the distribution of physics values for that particular window along with some statistics.
A log-normal volume distribution of segmented z-scores is shown below for 30-minute opening of the SPY. The Min and Max Cutoff at the top of the graph contain the part of the distribution whose intensities will be linearly color-coded between the Min and Max Colors of the color scheme. The part of the distribution below the Min Cutoff will be treated as lowest quality signals and set to the Min Color, while the few segments above the Max Cutoff will be treated as the highest quality signals and set to the Max Color.
What do I do if I don’t see anything?
Troubleshooting issues with this indicator can involve checking for error messages shown near the indicator name on the chart or using the Data Validation section to evaluate the statistics and normalization cutoffs. For example, if the Plot Window number is set to a window number that doesn’t exist, an error message will tell you and you won’t see any candles. You can use the Print Windows option to show windows that do exist for you current settings. The auto-normalization cutoff values may be inappropriate for your particular use case and literally cut the candles out of the chart. Try changing the chart time frame to see if they are appropriate for your cycle, sample and window time frames. If you get a “Timeframe passed to the request.security_lower_tf() function must be lower than the timeframe of the main chart” error, this means that the chart timeframe should be increased above the sample time frame. If you get a “Symbol resolve error”, ensure that you have correct symbol or spread in the Candle or Physics Source.
How do I see a relative physics values without cycles?
Set the Window Time Frame to be equal to the Cycle Time Frame. This will aggregate all the statistics into one bucket and show the physics values, such as volume, relative to all the past volumes that TV will allow.
How do I see candles without segmentation?
Segmentation can be very helpful in one context or annoying in another. Segmentation can be removed by setting the candle resolution value to 1.
Notes
I have yet to find a trading platform that consistently provides accurate real-time volume and pricing information, lacking adequate end-user data validation or quality control. I can provide plenty of examples of real-time volume counts or prices provided by TradingView and other platforms that were significantly off from what they should have been when comparing against the exchanges own data, and later retroactively corrected or not corrected at all. Since no indicator can work accurately with inaccurate data, please use at your own discretion.
The first version is a beta version. Debugging and validating code in Pine script is difficult without proper unit testing. Please report any bugs with enough information to reproduce them and indicate why they are important. I also encourage you to export the data from TradingView and verify the calculations for your particular use case.
The indicator works on real-time updates that occur at a higher frequency than the candle time frame, which TV incorrectly refers to as ticks. They use this terminology inaccurately as updates are really aggregated tick data that can take place at different prices and may not accurately reflect the real tick price action. Consequently, this inaccuracy also impacts the real-time segmentation accuracy to some degree. TV does not provide a means of retaining “tick” information, so the higher granularity of information seen real-time will be lost on a disconnect.
TV does not provide time and sales information. The volume and price information collected using the Sample Time Frame is intraday, which provides only part of the picture. Intraday volume is generally 50 to 80% of the end of day volume. Consequently, the daily+ OHLC prices are intraday, and may differ significantly from exchanged settled OHLC prices.
The Cycle and Window Time Frames refer to calendar days and time, not trading days or time. For example, the first window week of a monthly cycle is the first seven days of the month, not the first Monday through Friday of trading for the month.
Chart Time Frames that are higher than the Window Time Frames average the normalized physics for price action that occurred within a given Candle segment. It does not average price action that did not occur.
One of the main performance bottleneck in TradingView’s Pine Script is client-side drawing and plotting. The performance of this indicator can be increased by lowering the resolution (the number of sub-candles this indicator plots), getting a faster computer, or increasing the performance of your computer like plugging your laptop in and eliminating unnecessary processes.
The statistical integrity of this indicator relies on the number of samples collected per sample window in a given cycle. Higher sample counts can be obtained by increasing the chart time frame or upgrading the TradingView plan for a higher bar count. While increasing the chart time frame doesn’t increase the visual number of bars plotted on the chart, it does increase the number of bars that can be pulled at a lower time frame, up to 100,000.
Due to a limitation in Pine Scripts request_lower_tf() function, using a spread symbol will only work for regular trading hours, not extended trading hours.
Ideally, velocity or momentum should be calculated between candle closes. To eliminate the need to deal with price gaps that would lead to an incorrect statistical distributions, momentum is calculated between candle open and closes as a percent change of the price or value, which should not be an issue for most liquid securities.
